Introduction
Sequencing has become the most important scientific technique and the need for novel sequences is becoming greater by every day. As the sequencing applications are present in clinical diagnostic, comparative genomics, metagenomics, agriculture, medical genetic studies and forensic sciences. Currently, hundreds of species have been sequenced completely including human beings and important model organisms like mice. This wide range of sequencing and production of bulk data has shifted the focus towards analysis of this data to find genetic variations among individuals and to link phenotype with genotype.
Initially, after the development of sanger sequencing, it remained as the first choice of sequencing till 2005 but it was very expensive, laborious and time consuming. In the last decade, development of ‘next-generation’ techniques is done which is a massively parallel, high-throughput sequencing technique that allows sequencing of huge genomes in a short period of time and has significantly reduced the cost of sequencing. Thus, NGS has allowed us to do analysis of genomes more efficiently. The data generated by the NGS platform is straightforward and it undergoes downstream analysis by using multiple types of computational tools. For understanding, raw sequencing data a number of algorithms are required.
The major steps involved in NGS data analysis is given by following figure 1:
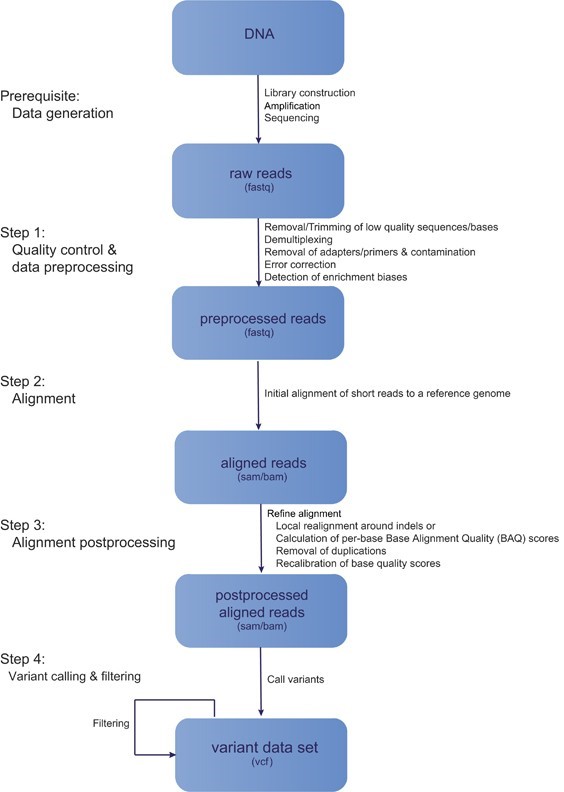
Figure 1: General workflow of Next Generation Sequencing
Here in this article our focus will be on step 1 i.e., quality control and data pre-processing.
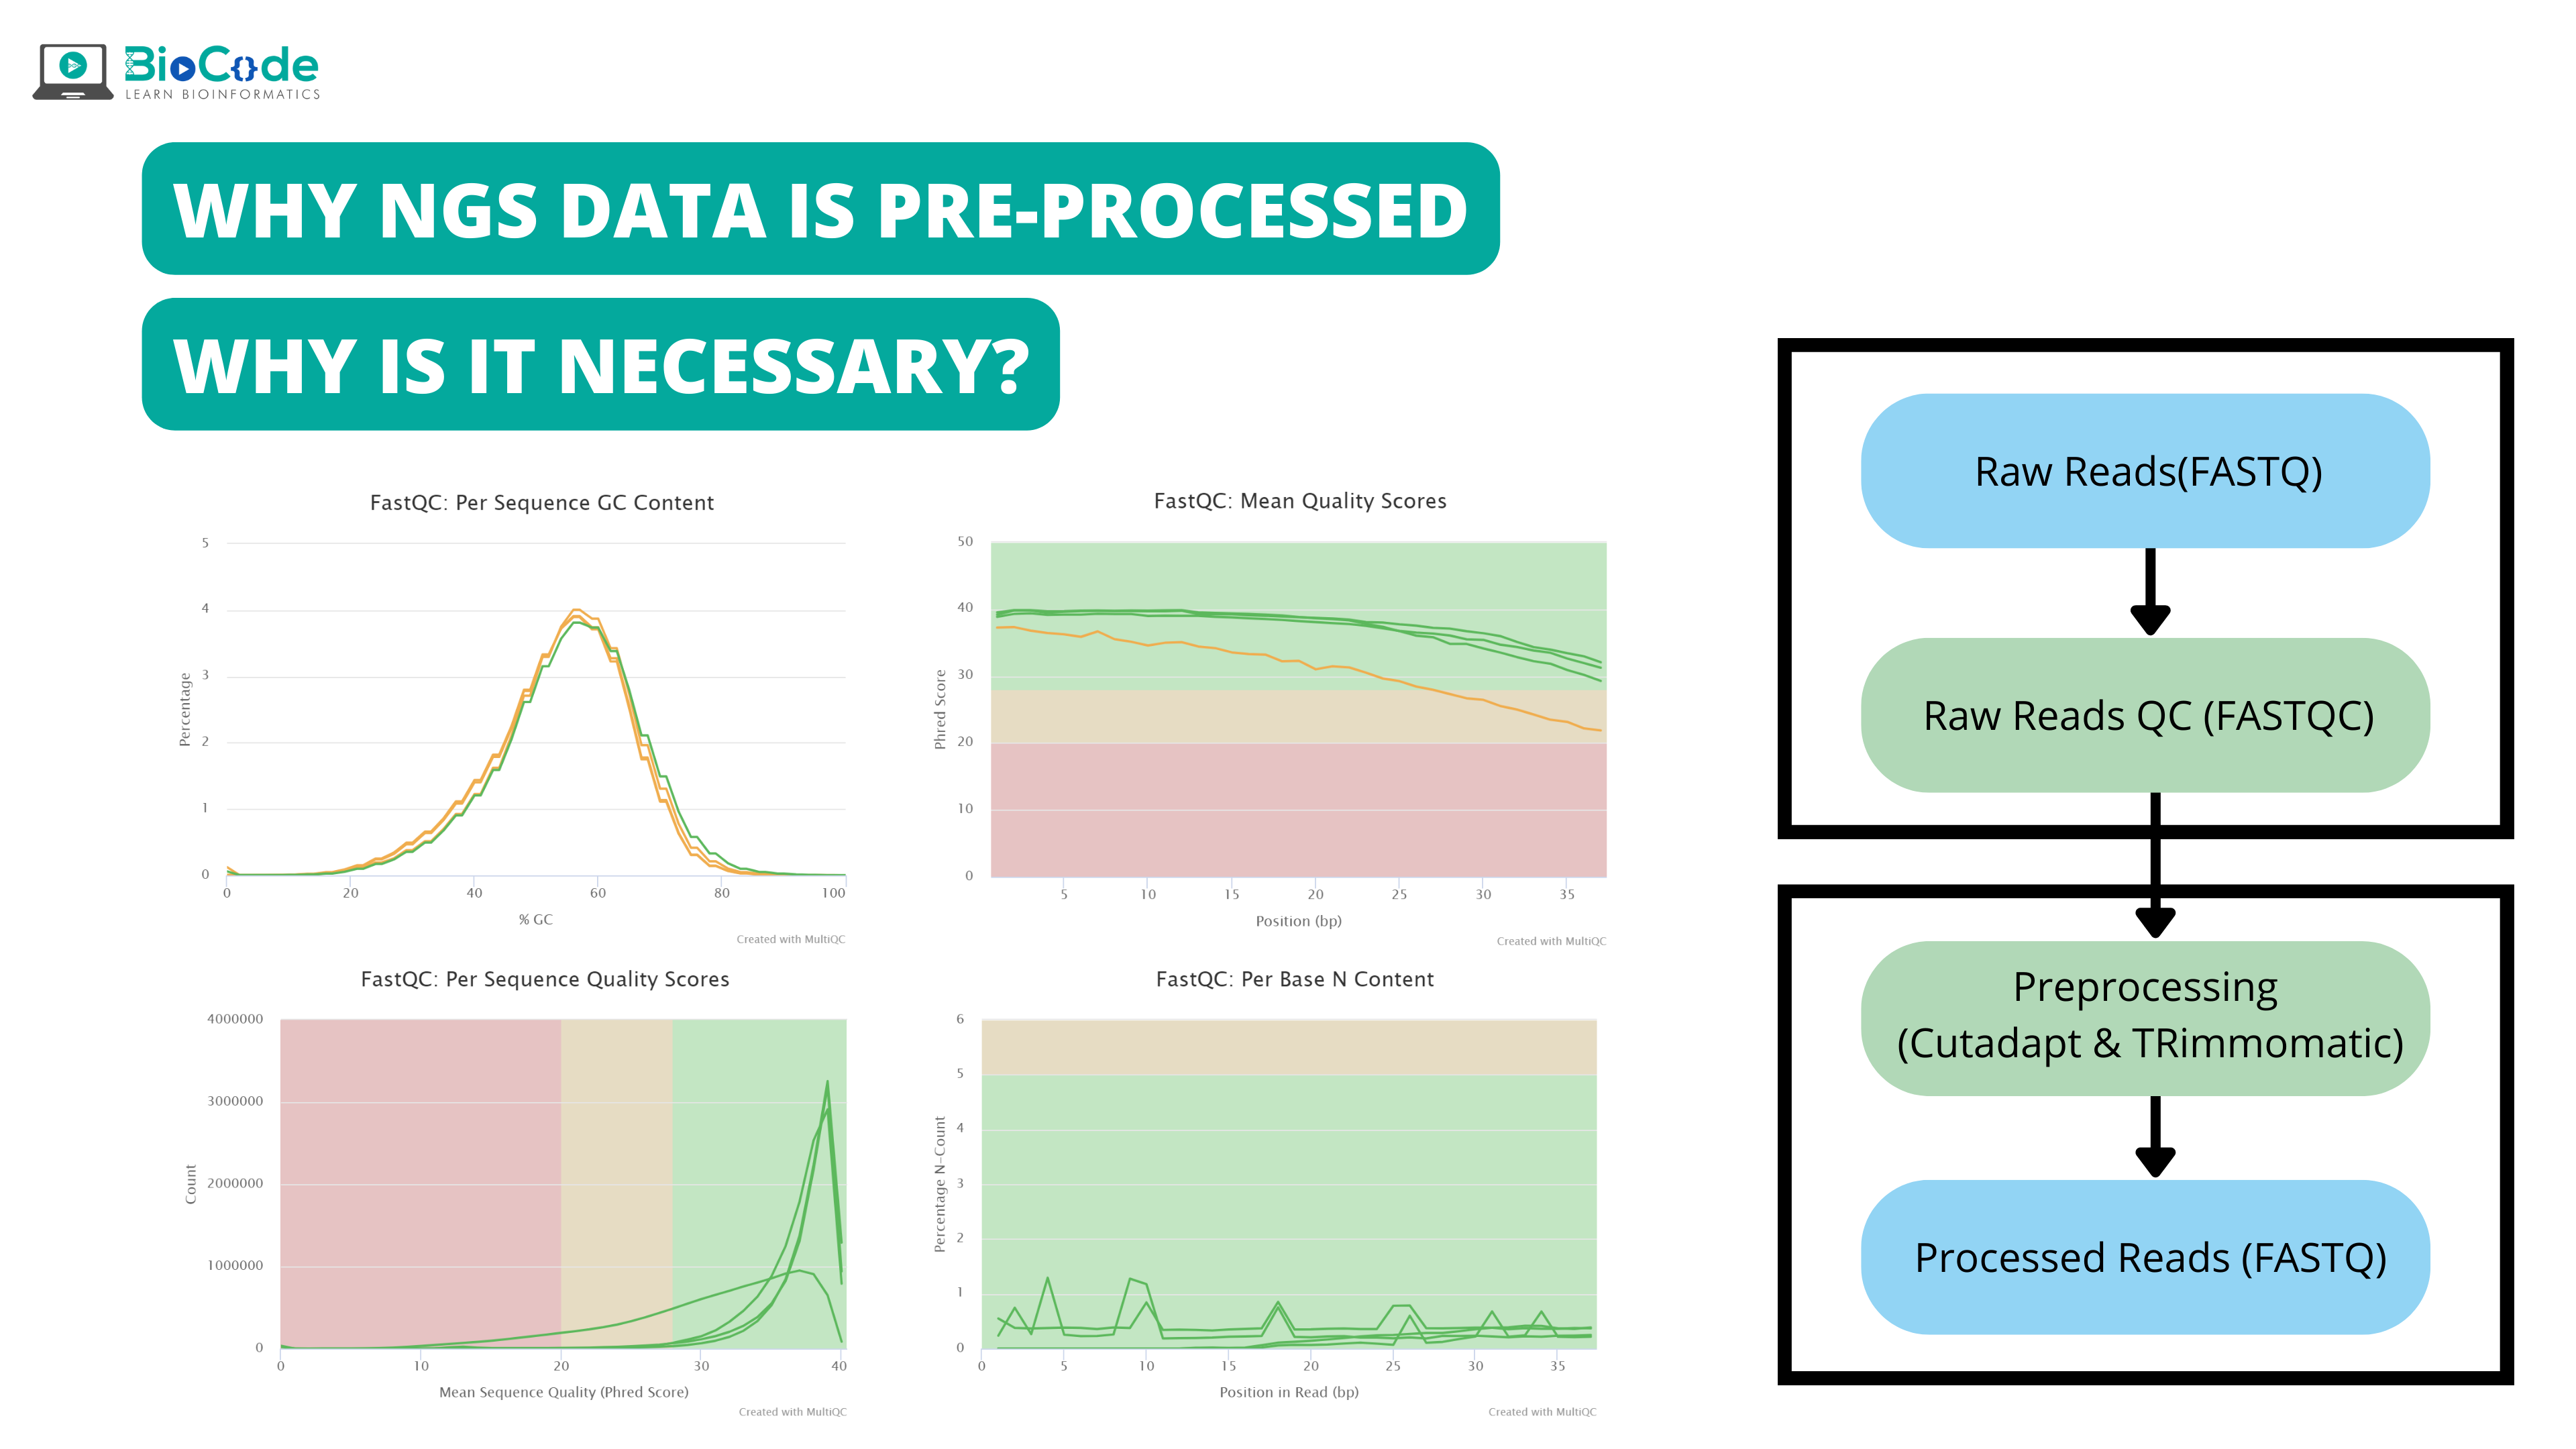
Pre-processing of NGS data and its necessity:
Quality control and pre-processing of data are important for data analysis because raw data produced after sequencing must be processed so that the results should not have false positive and false negative results. Pre-processing of data not only evaluate each analysis step but also it reduces the amount of low-quality sequence reads or adaptor contaminated sequence reads. Removal of such low-quality reads decrease time and cost of computation analysis and also reliable and high-quality results are obtained.
In any downstream analysis of NGS data, false-positive and false-negative results are produced due to:
Experimental Factors: Like sample contamination or PCR errors
Sequencing Factors: These include quality of sequencing and data contamination caused due to index hopping while splitting data.
Parameters of analysis software factors: this includes alignment softwares or precise type of parameter adjustment of downstream personalized analysis.
The raw sequences generated after sequencing not only contain our DNA sequence of interest, but it also has sequence biases, (for instance through systematic effects like Poisson sampling) and complex artifacts which are generated due to sequencing and experimental steps. These sequence biases and artifacts affect and interfere with precise read alignments which influence the genotyping and variant calling. Therefore, in order to increase the reliability and quality of downstream analysis and reduce the amount of required computational resources, the pre-processing of raw sequence reads is a necessity.
Quality assessment
Before any type of downstream analysis. Quality assessment is a must. The step identifies any potential problem or error in experimental setup and also it ensures that the correct samples have been sequenced with least amount of contamination and high amount of coverage. The overall quality of the sequence reads is assessed based on following parameters:
Nucleotide distribution
Quality score distribution
GC-content
Amount of sequence ambiguity
Duplication of PCR
The most widely used tools for quality control assessment includes htSeqTools, FastQC, NGSQC, qrqc, PRINSEQ, Kraken and SAMStat. This steps aids in selection of high-quality reads and overcomes problems at later stage of data analysis.
Here, we will discuss some of the potential issues in raw sequence reads generated and their effect on analysis:
Potential issue 1: low-quality data
The main characteristic of high-quality reads is that the majority of reads exhibit PHRED-like quality score over their entire length (Figure 2a). But, on the other hand, raw sequence reads having low-quality reads are found to have universal low-quality scores. These low-quality reads cause problems with readouts, air-bubbles or spot-specific signal noise during sequencing and thus it is important to exclude these reads from analysis. Beside these, some of the low-quality reads indicate a high systematic problem with run. Also, general quality loss is also indicated when large number of positions indicate without a base call i.e., the bases indicated as N.
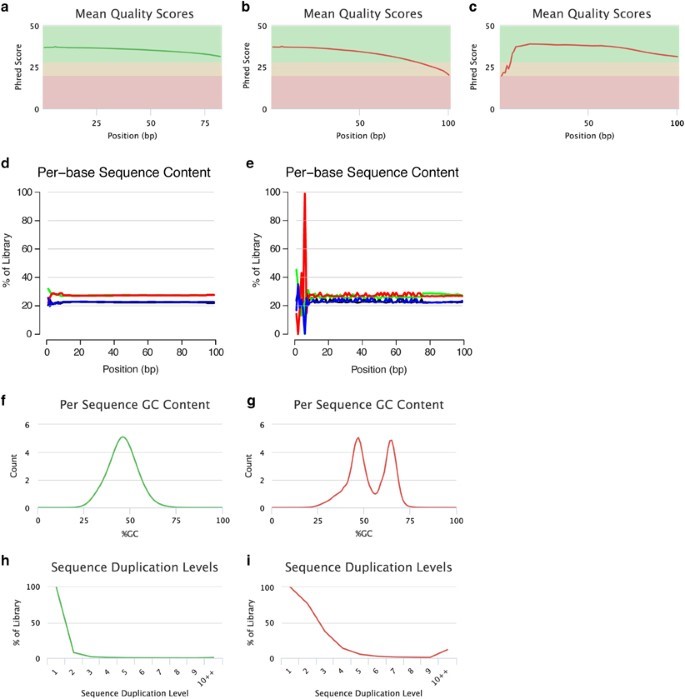
Figure 2: Assessment of the read quality. Per-base sequence quality plots indicate the mean quality scores for each nucleotide position in all reads. The colors in the background highlight the quality of the call i.e., green= High quality, Yellow=intermediate quality and Red= low-quality. (a) Reads with high base quality at each position. (b) sequence reads which are of high-quality initially but per base quality is decreased with increase read length, reaching low-quality values at the read end and needs trimming or pre-processing. (c) low- quality per base initially and then later recover as high-quality per base during run. In such cases, error-correction is applied rather than trimming. Per-base sequence content plots specify the proportion of each nucleotide for each read position. Examples: (d) A random library with little difference of base composition (colors indicate different nucleotides: green: A; blue: C; black: G; red: T) between single read positions. (e) Imbalance of different bases, potentially caused by overrepresented sequences (for example, adapters). Per sequence GC-content plots indicate the observed GC-content of all reads. Examples: (f) The GC-content of the reads is normally distributed with a peak that corresponds to the overall genomic GC-content of the studied species. (g) The bimodal shape of the distribution of the reads’ GC-content proposes that the sequenced library may have been contaminated or that adapter sequences may still be present. Sequence duplication plots indicate the level of duplication among all reads in the library (reads with more than 10 duplicates are binned). Examples: (h) The low level of sequence duplication suggests that a diverse library has been sequenced with a high coverage of target sequence. (i) A high level of sequence duplications often indicates either a technical artifact (for example, because of PCR overamplification) or biological duplications. All these examples were produced using FastQC and plotted using MultiQC.
In most of the sequencing platforms, the read quality per base is decreased with progression of the run because background noise is elevated due to signal decay and dephasing. In order to handle these low-quality bases, two types of strategies can be used. In the first strategy, it is assumed that the errors are random and infrequent, base-calls errors due to low-quality reads can be corrected by superimposing multiple reads and then altering low-frequency patterns by calling a consensus sequence with high-frequency. The sophisticated methods of error-correction are given by:
Spectrum-based Approaches: In these techniques, the sequence reads are decomposed in a set of k-mer fragments. These include SOAPec, Trowel, Reptile, Quake, Musket, Lighter, Hammer, DecGPU, CUDA-EC, BLESS, and BFC.
Suffix-tree/array-based methods: These include Hybrid-SHREC, SHREC, RACER, Fiona and HiTEC.
Multiple sequence alignment methods: These include Coral and ECHO.
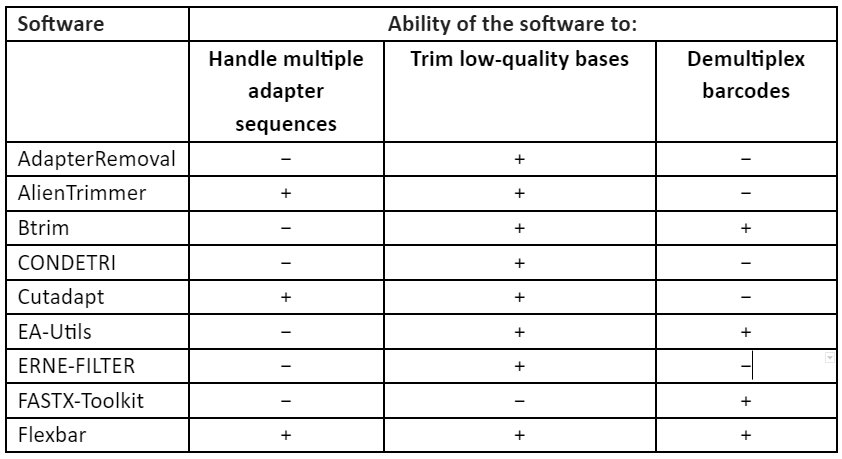
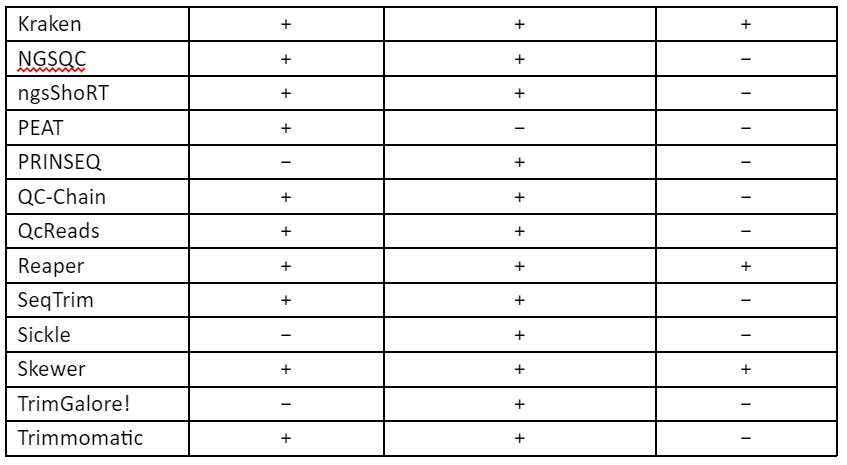
These techniques of error-correction require high-coverage and thus this makes them unsuitable for low to medium coverage studies, especially in case of non-model organism. Furthermore, the correction methods require a uniform distribution of sequence reads which make it not useful for many types of research like metagenomics and transcriptomics. Thus, to overcome these problems, second set of strategy was developed in which low-quality read regions can be removed by the estimation of error rates and by identification of suitable thresholds and this allows the retention of high-quality reads. These techniques are referred to as read trimming. There are many techniques for read trimming, some of them are tabulated in Table 1. The read trimming techniques can be categorized into two types: (1) window-based methods that locally scan a read using either a sliding or non-overlapping windows and (2) running-sum methods that globally scan the sequence read by using cumulative quality score to identify the best location for trimming.
Table 1: Techniques for read trimming
The reads can be of low-quality score at 5’ end due to air bubble passing through the flow cell during sequencing and then they recover as high-quality reads later in the run. In such cases, error-correction is advised rather than trimming. Also, there is an alternative to error-correction, in which the low-quality reads are masked before they are mapped to a reference genome. but, in cases where multiple samples are being sequenced simultaneously, the reads are distinguished by using barcodes (short and unique sequence) and low-quality reads in such samples results in several issues. It becomes an absolute necessity to demultiplex read data in the presence of possible sequencing errors in these barcodes. In order to overcome this problem, many methods have been developed to design barcodes which have the ability of error-correction that helps in accurate identification of samples in the presence of sequence variation occurring during synthesis, ligation of primers and sequencing or amplification.
Most popular techniques of error-correction are founded on false discovery rate statistics along with adaptation of both Hamming codes and Lowenstein codes. Algorithms based on these codes have ability to correct substitution errors and indels that are very important for sequencing technologies as indels are the primary source of errors.
Potential issue 2: presence of adapter sequences or contaminants
The sequence reads which are longer than the targeted DNA fragment are due to sequencing of complete or partial adapter or primer sequences, present at 5’ or 3’ end. These unwanted adaptor sequences lead to mismatching between the reads and reference genome sequences either causing false-positive variant calling or inhibiting alignment. The contamination of the adapter sequence at 5’-end is more problematic as most of the alignment tools need a high amount of similarity in this region and the issue is further enhanced in cases where the template sequence length is shorter. Thus, it is important to remove non-genomic regions from the raw reads before mapping them to the reference genome.
There are many ways in which the contamination due to adaptor sequences can be visualized. In the first approach, sequence per base should be examined. The relative proportion of each base at each position will show the overall sequence composition of the genome and also there should not be any difference in the base composition along the read in random library. If the imbalances of different bases are present, then it is due to overrepresentation of adaptor sequences.
In the second approach. GC-content per sequence should be examined and it should have a normal distribution with a peak in accordance with the total genomic GC-content of the species under study. If the GC content is not normally distributed then, it is indicative of the contamination present which may be due to adaptor sequences.
Besides these, the shapes of the peaks in distribution are sometimes indicative of adaptive sequences. For example, sharp shaped distribution indicated the presence of adaptor sequences while the multiple peaks or the broader peaks indicate contamination due to other species. In contrast, when a shift in distribution is observed then, it indicates systematic bias. Furthermore. The adaptor sequences can be detected automatically and they can be removed from genomic data, mostly during the data trimming of raw reads. There are also many other mitigation methods available to remove genomic contaminants and some of the popular tools include QC-Chain, DeconSeq and ContEst.
Potential issue 3: enrichment bias
In cases where the library is diverse, low amount of sequence duplication indicates that library has been sequenced with a high coverage of target sequence. In contrast, large number of sequence duplications arise due to technical errors like PCR overamplifications or due to biological duplications like samples containing multiple strains of viruses. The technical duplications need to be removed as they appear as a high read coverage support which leads to faulty variant calling.
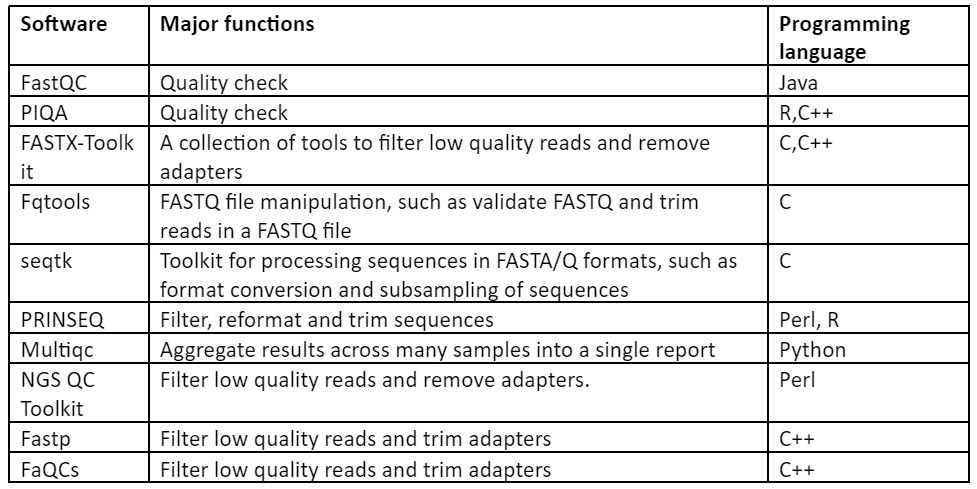
Thus, with the above discussion it has become quite clear that in order to have an accurate output of downstream analysis, pre-processing is a necessary step. Some of the important software used for this purpose are given by:
Table 1: Software for Pre-processing of NGS data
Conclusion
At the moment, there are a large number of softwares available for data quality control and pre-processing of NGS data but in most of the methods, the unwanted or low-quality bases are cut-off to maintain the quality. These softwares do not take into account the distribution of low-mass bases in sequences and this can result in many short sequence reads, thus affecting the accuracy and reliability of downstream analysis. Thus, it is concluded that the pre-processing is no doubt an important step for data analysis and for accurate output but the tools must be developed to process the data in a better way that should not affect the analysis.