Introduction
Molecular biology study outlines the central dogma which is the flow of Information stored in genes as DNA, transferred through transcription as RNA, and understood through translation as proteins. this central dogma also depicts the expression of genes and it is altered or affected by changes in the environmental factors that characterize an organism’s phenotype. The gene transcription into RNA indicates the identity of the cell and it regulates many important biological activities in the cell. Collectively, they are referred to as transcriptomes and they are important as they allow us to understand the functionality of the genome and their association with a particular phenotype.
With the advent of Next-generation sequencing (NGS) technologies, transcriptome analysis has also been revolutionized. This high throughput transcriptome analysis technique is known as the RNA-seq, in which RNA is sequenced by forming complementary DNA and then analyzed to understand gene expression. RNA- seq provides us with a quantitative view of the gene expression, alternative splicing, and allele-specific expression.
Overview of RNA-Sequencing
The workflow of RNA-seq is given by:
Step One: RNA Isolation
In the first step, RNA is isolated from the biological sample. For an accurate RNA-seq analysis, RNA should be of high quality to produce sequencing libraries. In some cases, high-quality RNA samples are not available, like in the case of human autopsy samples or paraffin-embedded tissues, and in these cases, the effect on sequencing results must be taken into account while analysis.
Step Two: RNA-Seq Library
The next step is the library preparation, it can be varied depending upon the species under study and the NGS platform. The RNA-seq libraries are generated by reverse transcribing the isolated RNA into cDNA, fragmenting it with restriction enzymes or amplifying it with random primers, and finally ligation of the adaptor sequences.
Step Three: Amplification and sequencing
In this step, PCR amplification and sequencing are done with a specific type of NGS platform.
Step Four: Analysis
In this step, the raw reads generated by the sequencer are assessed for quality and then processed for downstream analysis, which involves alignment and variant calling.
The overview of RNA-seq is given by following figure 1:
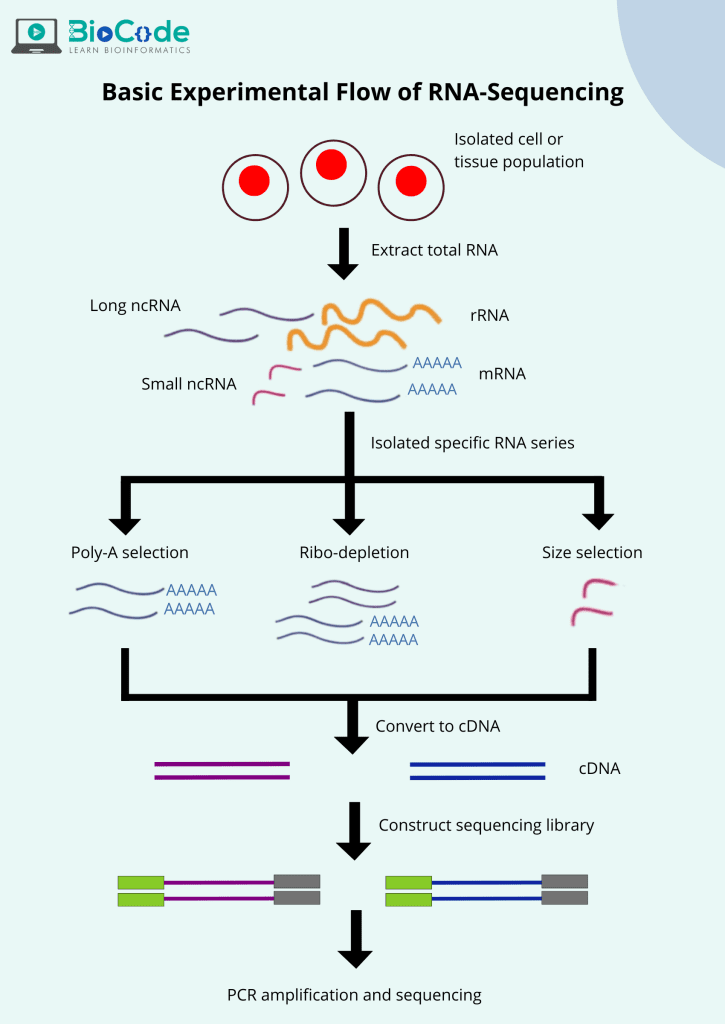
Figure 1: Workflow of RNA-sequencing
Here, we will discuss RNA-seq downstream analysis in detail.
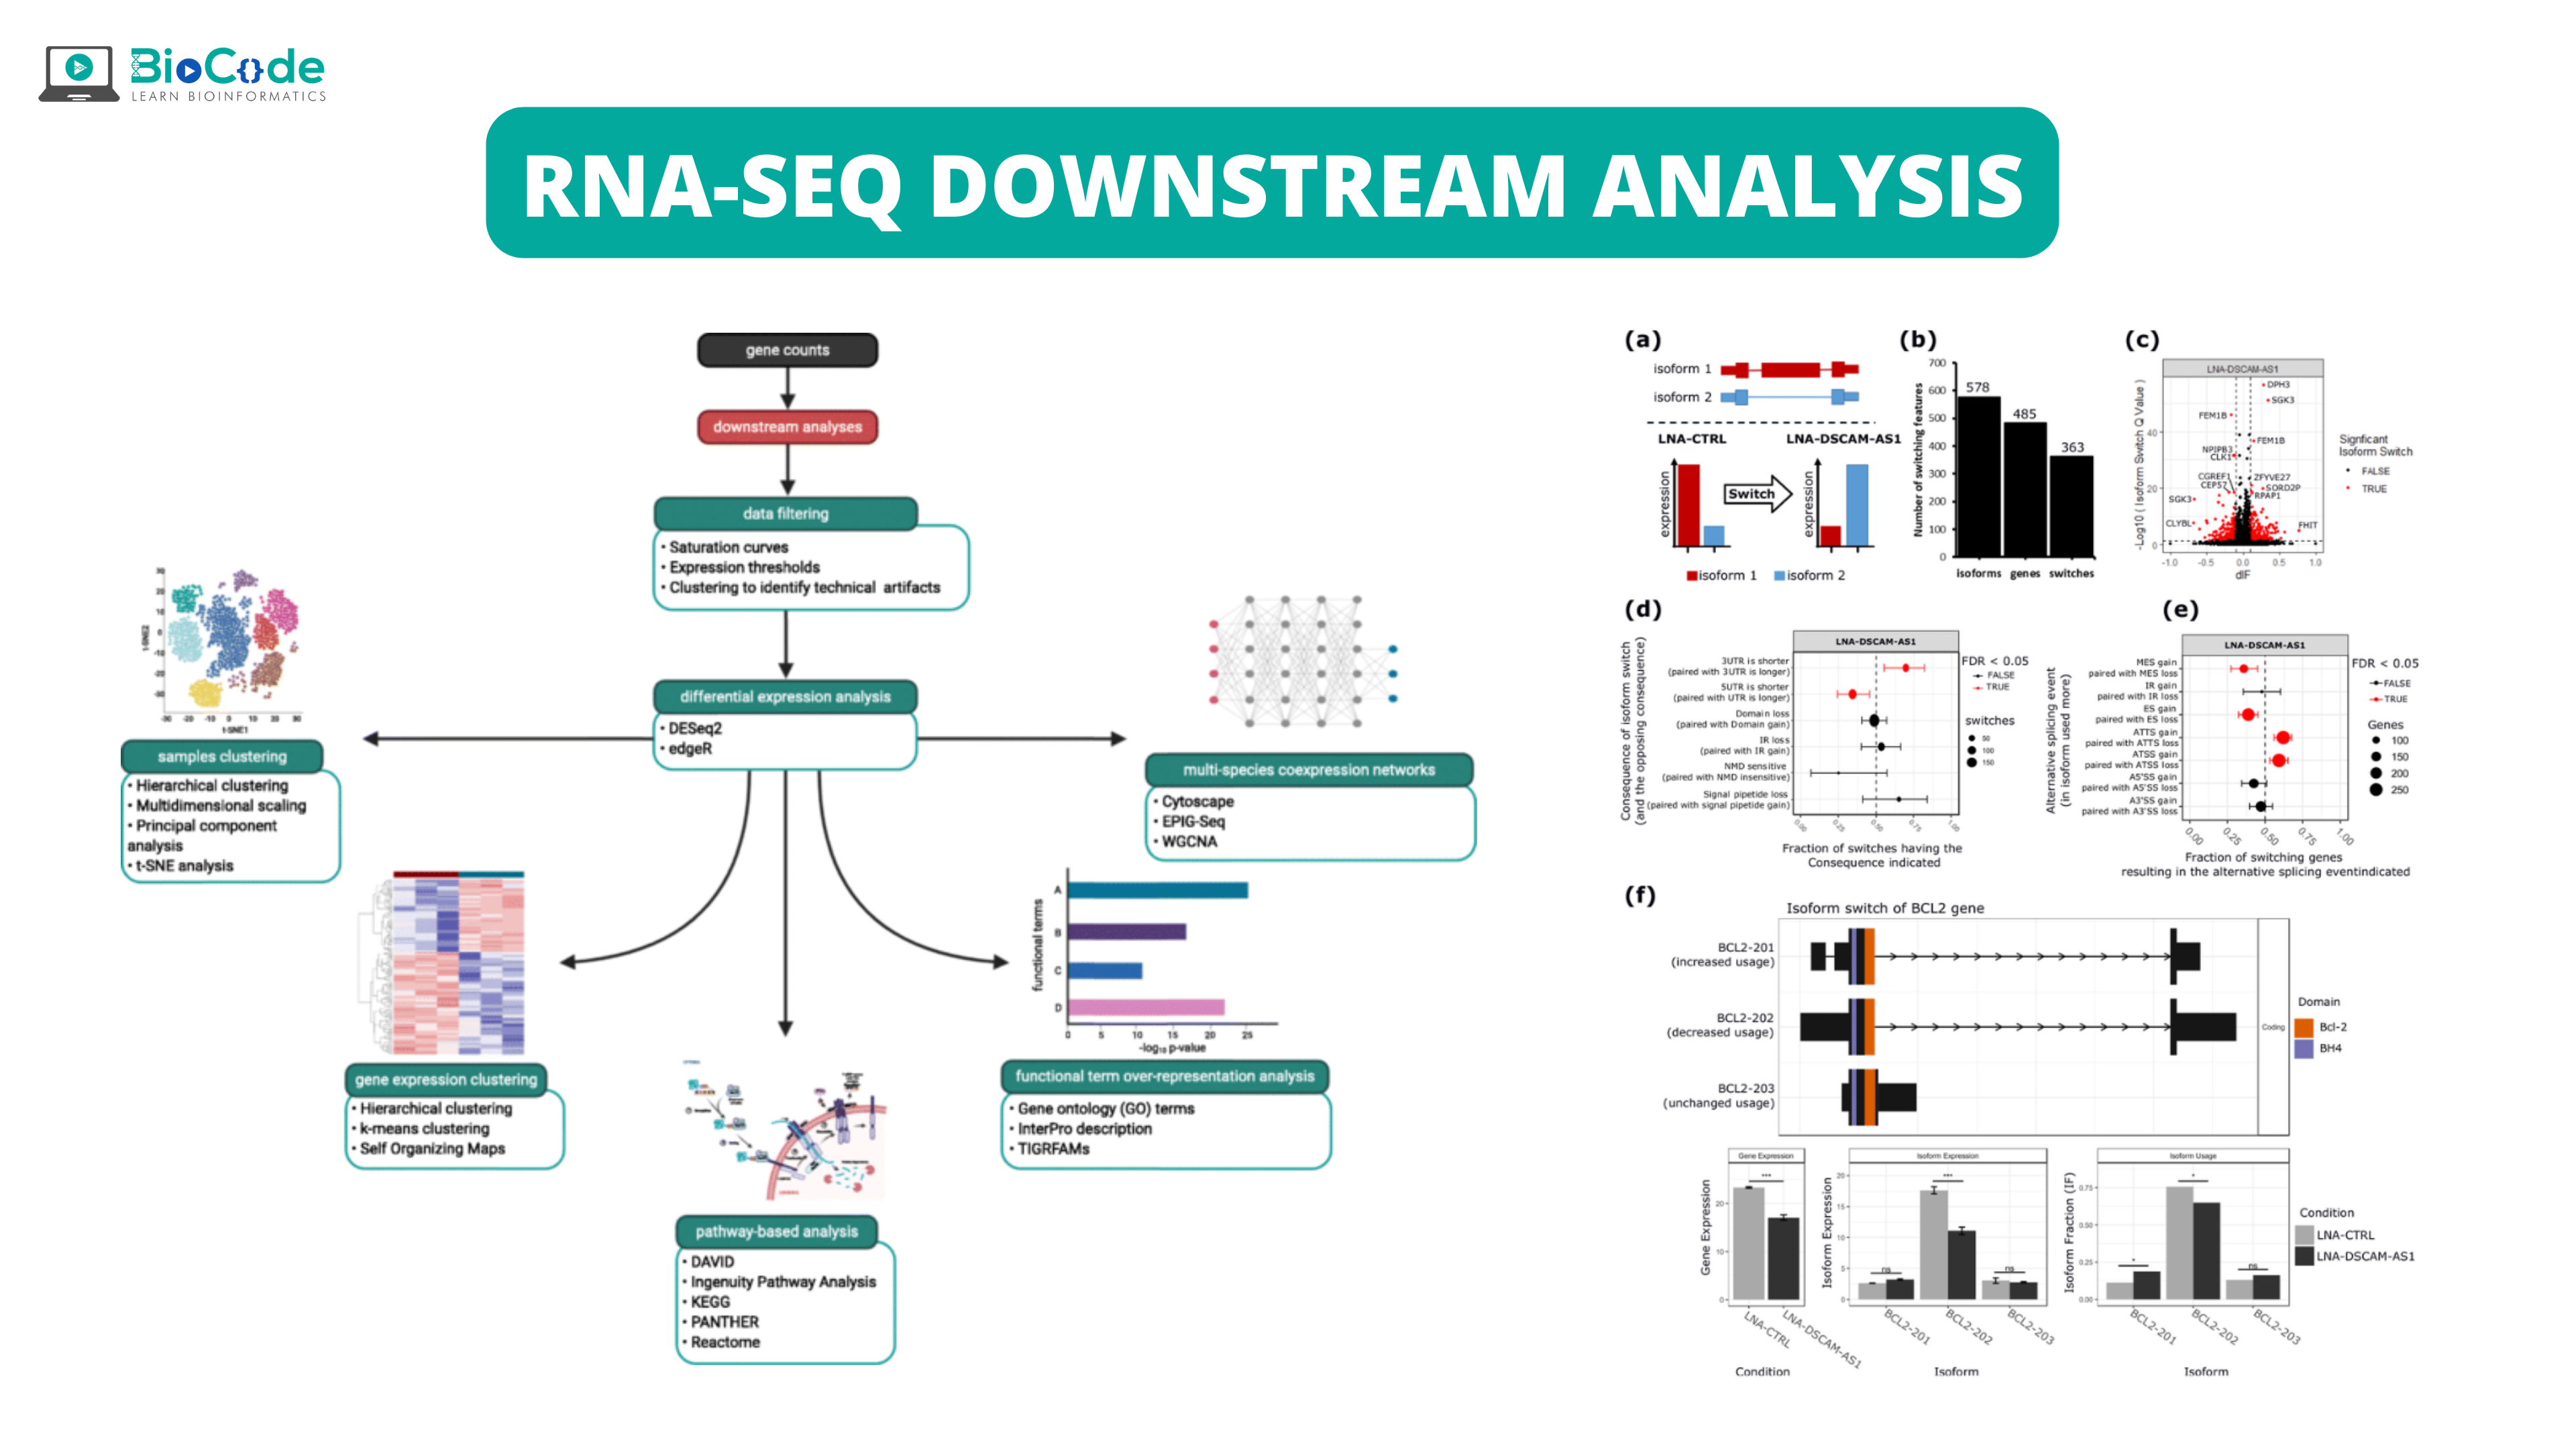
RNA-Seq downstream analysis
With the help of RNA-seq, gene expression profiling is done with a high-resolution view of the global transcriptional landscape. As the advancements in sequencing technologies are continuously being done, new bioinformatics tools and applications have been developed for analysis. RNA-seq not only allows us to understand gene expression analysis, but also helps us to discover new gene structures, allele-specific expression, and alternatively spliced isoforms. In this section, we will discuss different steps involved in the data analysis of RNA-seq.
RNA-Sequencing Data Analysis Workflow
In a conventional analysis pipeline, RNA-seq data generated by the NGS platform is in the FASTQ- file format, it is then aligned to an annotated reference genome and then the gene expression is quantified. Even though most of the analysis tools are easily accessible, the computational analysis of RNA- seq data is challenging and it needs special consideration of the biases present in expression data.
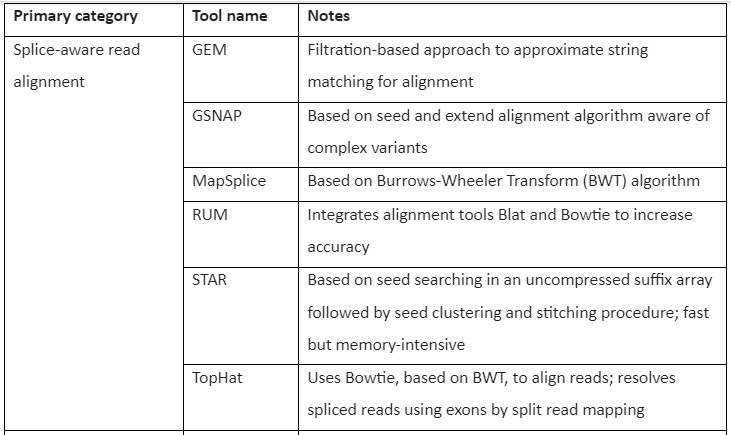
Read Alignment
Mapping RNA-seq to the reference genome is considered more challenging than the mapping of the DNA to the reference genome. Conventional read mapping software like BWA and Bowtie is not recommended to be used for the mapping of RNA-seq reads because of their inability or limitation in the handling of the spliced transcript. To overcome this issue, an approach is used in which sequences are added to the reference genome derived from exon-exon splice junctions taken from the known annotated gene. The most favored strategy is the mapping of read to a “splicing-aware” aligner that can differentiate a read aligning across the boundary of exon-intron and a read with short insertion. With the increased need for RNA-seq techniques and transcriptome analysis, several splicing-aware tools have been developed for alignment and mapping. The most commonly used tools include GSNAP, TopHat, STAR, RUM, and MapSplice.
Each mapping software has its performance, advantages, memory use, and speed. The selection of the best aligner depends upon the transcriptomic study and metrics which are being considered. The systematic evaluation of RNA seq aligners has been initiated by GENCODE’s RNA-Seq Genome Annotation Assessment Project3 (RGASP3), it has found that different alignment tools have different performances based on benchmarks like a mismatch and gap placement, basewise accuracy, and exon junction discovery.
Transcript Assembly and Quantification
After the alignment of RNA-seq data is done, the next task is to assemble the mapped reads into transcripts. Many computational tools can deduce transcript models from the accumulation of read alignments to reference the genome. In contrast to this, there is another approach known as de novo reconstruction. In this approach, reference genomes or annotations are used to assemble contiguous transcript sequences. The assembly of reads becomes challenging when we have short-read data and in such a case, there is no reliable or gold standard method. The quality of transcriptome assembly is affected by the nature of the transcriptome i.e., degree of polymorphism, gene complexity, the dynamic range of expression, and alternative splicing. Furthermore, transcriptome nature is also affected due to technological errors like sequencing and bioinformatics workflows like gene annotation and inference of isoforms.
The transcript reconstruction software has a common downstream feature which is the gene expression level estimation. The computational software like FluxCapacitor, Cufflinks, and MISO quantify the gene expression level by counting the number of reads mapped to full-length transcript. Alternative techniques like HTSeq, can quantify expression without transcript assembly and by counting the number of mapped reads to an exon. For correct gene expression estimation, the normalization of read count is required to correct for systematic variability like sequence composition bias, read depth, and library fragment size. To interpret this variability the reads per kilobase of transcripts per million mapped reads (RPKM) metric is used to normalize a read count of the transcript by both the length of the gene and the total number of mapped reads present in the sample. In the case of pair-end reads, read count is normalized with the paired fragments per kilobase of transcript per million mapped reads (FPKM) metric, it accounts for reliance between RPKM estimate and paired-end read.
In transcript quantification, another technical challenge faced is to map reads to multiple transcripts which are the culmination of genes having multiple isoforms or close paralogs. This challenge is overcome by correcting for “read assignment uncertainty”, in which all the reads are excluded that are not mapped uniquely as in Alexa-seq. but this strategy is not ideal for genes that lack unique exons. So, an alternative approach is used by MISO and Cufflinks. In this approach, a likelihood function is constructed that models the sequencing experiment and evaluated the maximum likelihood that a read will map to a particular isoform.
Quality Assessment and Technical Considerations
In the RNA-seq analysis pipeline, quality assessment and consideration are done to identify and amend many sources of bias. The bias in the analysis can occur due to:
RNA-seq experimental errors like sample preparation, sequencing, and library construction.
Mapping of reads
To ensure the quality, firstly the raw sequence data is evaluated to ensure the presence of high-quality reads. For this purpose, tools like FASTX-toolkit, the FastQC software, and the RobiNA package are used. With the help of these computational tools, many important parameters are evaluated including adaptor contamination, sequence diversity of reads, nucleotide composition, base qualities, and called bases percentage. These technical issues originated at the stage of sequencing or during the RNA-seq construction. For instance, 5’end reads which are derived from double-stranded cDNA fragment end display a high rate of error due to mispriming occurring during the construction of the RNA-seq library. It is quite important to remove these biases by using approaches like trimming and error correction to improve the quality of reads before alignment.
After the alignment of the reads has been done, some additional parameters are needed to be assessed for biases at the stage of mapping reads. The parameters include the percentage of reads mapped to the transcriptome, coverage bias present at 5’ and 3’-end, percentage of reads having mapped mate-pair, and reads chromosomal distribution. The most common reason for mapping error of RNA-seq data is when the read extends to the splicing junction of alternatively spliced genes. Also, misalignment can occur due to ambiguous mapping of the sequence read end to one or more possible exons and this is more common in cases where reads are mapped to a reference genome that has an incomplete annotation of isoform.
Besides this, the integrity of the samples is evaluated if the information of genotype is available by determining the correlation of single-nucleotide variants (SNV) in RNA reads and DNA. This comparison will allow us to determine sample mixture or sample swaps occurring due to personnel, equipment, or accidental errors. In cases where we have swapped samples, the variants observed between DNA and RNA sequencing data will be more discordant. On the other hand, in the case of a mixture of samples, allele-specific expression patterns will be more significant than expected for a single individual.
Differential Gene Expression
The main objective of gene expression analysis is to identify and detect transcripts showing differential gene expression across multiple conditions. Early studies of RNA-seq suggested that read count distribution across replicated is indicated with a Poisson distribution, which then laid the basis for modeling of RNA-seq count data. But later on, with more research, it was found that the biological variability is not best explained with the Poisson assumption, which has resulted in a large number of false-positive results due to the under-consideration of sampling errors. Thus, models with a negative binomial distribution that use overdispersion or extra Poisson variation have been revealed to be appropriate for the distribution of read counts across biological replicates.
Complex statistical models have been developed to model the RNA-seq count-based data. These models handle variability sources across biological and technical replicates. One of the variability sources is the read depth, this can create differences between samples artificially. For example, if the difference in read depth is present then the samples will appear more divergent when the raw read counts are compared among genes. To solve this problem, it is recommended to transform the data of raw read count to FPKM or RPKM values in differential gene expression. Even though this solution or the correction metric is being used in the position of read counts, but the RPKM and FPKM values can be significantly altered due to the presence of many highly expressed genes in a sample. For instance, if we have a highly expressed gene, then it has an ability to “absorb” many reads, which results in repression of read counts for other genes and it also artificially inflates the gene expression variation. To overcome this bias, many statistical models have been proposed which make use of highly expressed genes as the model covariates. Besides this, there is another source of variability in which the sequence read distribution is unequal across the genes. For this variability, a generalized Poisson model with two parameters was developed which considered sequencing bias and read depth as two independent parameters and this approach showed improvement in the analysis of RNA-seq data.
For differential expression detection, many statistical methods are designed specifically for RNA-seq data. One of the popular tools used for differential analysis is Cuffdiff. It is the part of Tuxedo suite of tools that includes Bowtie, Tophat, and Cufflinks, which were developed for the analysis of RNA -seq data. Besides Cudddiff, other packages that support differential gene expression analysis include DEGseq, DESeq, baySeq, and edgeR. Even though these packages can assign significance to transcripts with differential expression, care should be taken while interpreting biological information.
Allele-Specific Expression
One of the main advantages of RNA seq analysis is its ability to do transcriptome dynamics profiling at the resolution of a single nucleotide. This allows the coverage of sequenced transcript reads across heterozygous sites, which shows transcription from paternal and maternal alleles. If in an experiment, sequence reads cover a sufficient number of heterozygous sites in a gene, then according to the null hypothesis, the ratio of maternal alleles to paternal alleles is balanced. When a significant deviation is observed from this hypothesis then, it suggests allele-specific expression (ASE). The potential reasons for ASE include genetic variation and epigenetic effects.
To detect ASE conventional workflows, count reads having each allele at heterozygous sites and then apply a statistical test like a binomial test or Fisher’s exact test. Still, there is a need for more rigorous and robust statistical approaches to overcome technical issues in the detection of ASE. These technical challenges include:
Overdispersion at extreme read depths
Sampling variance
Alternatively spliced alleles
Indels (insertions and deletions)
Genotyping errors
To overcome overdispersion, allelic read counts are modeled using beta-binomial distribution at individual loci; nevertheless, for accurate estimation replicates are needed by overdispersion replicates and as per research, the main source of bias or variation comes from site-specific mapping difference. Thus, another strategy is developed, which uses a hierarchical Bayesian model that assembles information across loci, replicates and technologies, to deduce site-specific output for ASE. To evaluate reference-allele mapping bias, the number of mismatches in the reads having non-reference alleles is assessed as a high amount of bias is detected with the greater divergence of sequences between alleles. For solving read-mapping bias, an enriched reference genome is developed that masks all the positions of SNP or take into account the alternative alleles at polymorphic loci. Many other statistical methods are being developed to improve ASE detection.
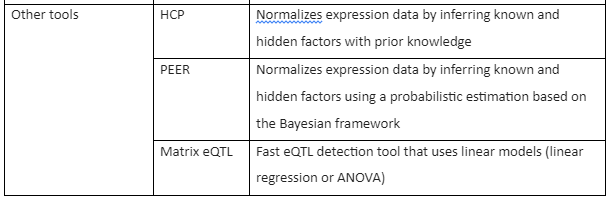
Expression Quantitative Trait Loci
RNA-seq studies have allowed the integration of gene expression data with other forms of biological information like data of genotyping. This combination of RNA-seq with genetic variation data has allowed the detection and identification of genetic loci associated with gene expression variation, known as the expression quantitative trait loci (eQTLs). RNA-seq analysis has given a new direction to eQTL analysis because it has enabled the association analysis of more than just the gene expression level analysis. Conventional eQTL mapping, methods use a linear model like linear regression and ANOVA to link genetic variation with gene expression. These methods have also been applied to RNA-Seq data after the total read counts have been properly normalized.
In most of the eQTL studies, each transcript-SNP pair is separately tested by using ANOVA and linear regression models to detect a significant association. There are also non-linear approaches that have been developed to determine associations, for instance, Bayesian regression. Furthermore, alternative models like Merlin are also developed to determine eQTLs from gene expression data that contain related individuals using pedigree data. Also, many methods have been developed to test the impact of multiple SNPs on the expression of a single gene by Bayesian methods.
The Tools for RNA-seq downstream analysis are given by following table 1:
Table 1: Tools for RNA-Seq Downstream analysis

Conclusion
RNA-Sequencing is an advanced methodology for transcriptomic analysis. The main part of RNA-seq is the computational analysis which is done with an array of programs developed for the analysis of RNA sequencing data. But still, there is a need to develop more precise and accurate computational resources especially for the alignment of long reads and for accurate analysis.

I like to learn this field on this website
Nice
Hello There. I found your blog using msn. This is a really well written article.
I will be sure to bookmark it and come back to read more of your useful info.
Thanks for the post. I’ll definitely comeback.