What is transcriptomics?
Transcriptomics is the study of transcriptomes i.e., the entire set of RNA transcripts produced by genome under specific conditions in specific cell types by employing high-throughput techniques like RNA-sequencing and microarray analysis. The information stored in DNA of an organism is expressed through transcription with the formation of an intermediary molecule i.e., mRNA which is then translated into proteins for a specified role and diverse function. This is also referred to as the gene expression.
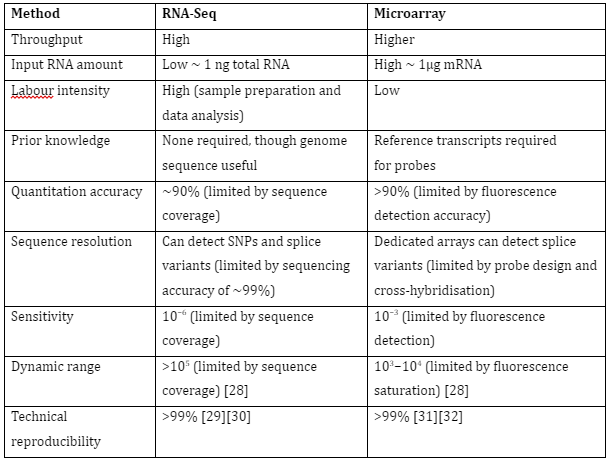
The gene expression of an organism is measured in different conditions, tissues or time to understand the regulation of genes and information about the organisms’ functioning. Furthermore, the functions of unannotated genes can also be determined. The study of transcriptomes has allowed us to understand gene regulation in multiple organisms and most importantly it has allowed us to understand human diseases. The two most common techniques used for transcriptomics are RNA seq and microarray. Their comparison is given by Table 1:
Table 1: Comparison of RNA-seq and Microarray
Pipeline of Transcriptome analysis:
The stages involved in transcriptomics technologies for analysis of transcriptomes are given by:
Stage one: Data assembly
The first stage is the gathering of data for analysis. This can be attained by two main principles i.e.,
Sequencing of individual transcripts
Hybridization of transcripts to the oligonucleotide probes
The important steps in this stage are explained below:
Isolation of RNA
No matter what type of analysis method we are employing in transcriptomic study, the first step will always be the isolation of RNA. Although the biological systems are quite varied, the technique of RNA extraction is almost similar in every organism. For RNA extraction:
Mechanical disruption of cells or tissues
Removal of RNases with chaotropic salts
Macromolecules and nucleotide complexes disruption
Separation of RNA from all other biomolecules
RNA precipitation and purification
After the RNA is isolated, it is converted into cDNA with the help of RT-PCR. If microarray is to be done, then, they are amplified with qPCR and properly labelled. For RNA-seq, mRNA is selected and library construction is done, after that the transcripts are barcoded before sequencing. An overview of both the techniques is given below.
Microarray
The microarray consists of short oligonucleotide sequences that act as “probes”. These probes are arrayed on a solid support like glass. The transcript abundance is found out by hybridization of fluorescently labelled transcripts to the probes. The intensity of fluorescence produced at each probe gives the transcription abundance of that specific probe sequence.
Microarray needs prior knowledge about the organism under experimentation in the form of EST library or annotated gene sequence. This information is required to produce the probes.
Microarray method is illustrated in figure 1:
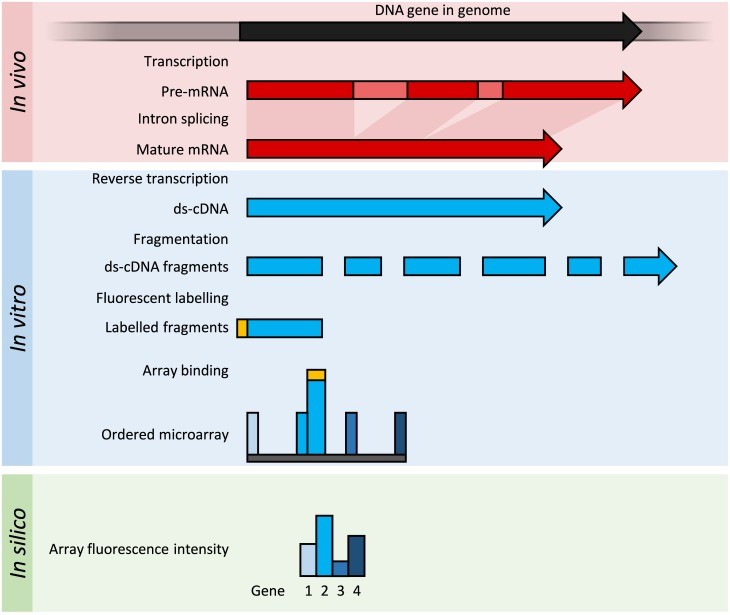
Figure 1: In the organism of interest, the transcription results in formation of a pre-mRNA which is then processed (splicing) and mature mRNA is produced. This mRNA is extracted and then cDNA is produced by reverse transcription (ds-cDNA; blue). In microarray analysis, this cDNA will be fragmented with specific restriction enzymes and then fluorescently labeled (orange). The labelled fragments are then allowed to bind on with complementary probes (oligonucleotides) present on the solid surface and fluorescence is measured. The intensity of fluorescence across each nucleotide will tell us about the abundance of a predetermined set of sequences. These sequences of high abundance are then chosen as they can give us information about the gene of interest in the organism under consideration.
RNA-Sequencing
On the other hand, RNA sequencing is based on methodology of high throughput sequencing supplemented with various computational methods in order to identify and quantify the transcripts present in extracted RNA. The nucleotide sequences which are produced are mostly 100 bp in length but they can be in the 30 bp to 10,000 bp range, depending upon the type and platform of sequencing employed. RNA-seq allows deep sampling of transcriptomes having lots of short fragments to enable the reconstruction of original RNA transcript with the help of computational techniques. This is done by aligning the sequence reads to either a reference genome or with each other (de novo assembly). The method of RNA-seq is illustrated by following figure 2:
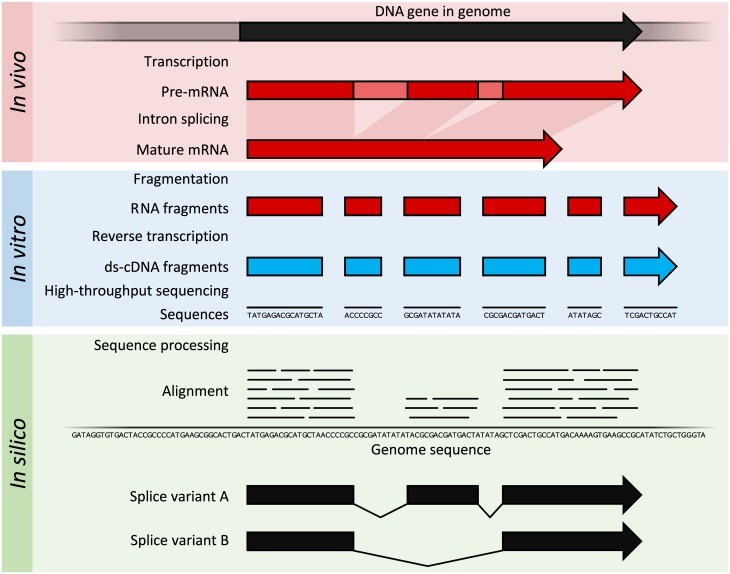
Figure 2: The transcription and splicing results in generation of mature mRNA in organism and then this mRNA is extracted. After that, extracted RNA is fragmented and reverse transcribed to produce ds-cDNA (ds-cDNA; blue). This cDNA is then sequenced through high-throughput sequencing techniques and short-read sequencing methods. Then, the sequences are aligned to a reference genome in order to reconstruct the original RNA transcript. The data generated can be utilized to annotate the location of expressed gene, their level of expression and also their any alternative splice variants.
Stage 2: Data Analysis
Stage two of transcriptomics is the most important step i.e., data analysis of the data gathered by using microarray analysis and RNA -sequencing experiments. The analysis is done with the help of many computational tools and programs. The data generated with microarray analysis is composed of high-resolution images that require feature detection and spectral analysis. Many short probes identical to a single transcript can tell us about the structure of an intron-exon and it needs various statistical models to know the validity of the resulting signal.
On the other hand, RNA-seq produces >109 short RNA sequences and they must be aligned with the reference genome which is composed of millions to billions of base pairs. In case of de novo assembly of reads in a dataset needs the generation of highly complex sequence graphs. The operations of RNA-seq are highly repetitious and they get advantage from parallel computation, but the modern computing algorithms require sufficient hardware resources for even a simple transcriptomics experiment that does not need de novo reads to assemble. For example, the transcriptome of human beings can be determined by using RNA -seq having about 30 million 100 bp sequences per sample. Also, the processed data of each gene will be smaller, almost equivalent to microarray intensities. The sequence data can be stored in public data repositories like the Sequence Read Archive (SRA). The data of RNA-seq dataset can be uploaded through the Gene Expression Omnibus.
Important steps of the data analysis are briefly explained below:
Image Processing
In Microarray: The image processing of microarray analysis must appropriately identify the regular grid of features in an image and quantify the fluorescence intensity of each feature independently. Image objects are also needed to be identified and removed from the full analysis. The intensity of the fluorescence indicates each sequence’s abundance. Some of the tools include EzArray and BASE.
In RNA-Seq: The first step of RNA-seq data analysis is also image processing but the conversion of images to sequence data is done by the software present in the instrument. The sequencing by synthesis done with illumine platform results in production of random or ordered arrays of clusters which are distributed over the flow cell surface. During each sequencing cycle, the flow cell is imaged up to four times with a total of tens to hundreds of cycles. The clusters of flow cells are analogous to spots of microarray and they need to be correctly identified during the early sequencing process stages. Similarly, in the pyrosequencing method of Roche’s platform, the amount of consecutive nucleotides in homopolymer repeat is determined by emitted light intensity. This method has many variants, each having a different error profile for producing data.
Data Analysis of RNA seq
After the RNA-seq experiment, a large amount of data in the form of raw sequence reads is produced and this data needs to be processed for vital information. The analysis of data is done with the combination of many different bioinformatics tools that are needed as per the aim and design of the experiment. Most of the widely used RNA-seq programs have a command-line interface, either within the R/Bioconductor statistical environment or within a Unix environment.
The process of RNA-seq data analysis can be divided into four stages as explained below:
Quality control: The sequence reads produced as a result of RNA-seq experiment are not perfect and they are required to be processed before a downstream analysis. The raw sequence reads are analyzed for scoring high-quality reads for base calls, content of guanine-cytosine comparable to expected distribution, the overrepresentation of mainly short sequence motifs (k-mers) and unexpected high rate of sequence duplication. There are many important packages for quality control analysis, but mostly used tools are FastQC and FaQCs. After the abnormalities have been identified, the sequence reads are either trimmed or tagged for a special treatment in later analysis.
Alignment: In order to associate the sequence read abundance to particular gene expression, the transcript sequences are aligned to a reference genome or they are aligned to each other in the absence of reference genome (de novo alignment). The main challenge for any alignment software is the amount of time needed to align >109 short sequences, flexibility to determine and deal with eukaryotic intron splicing and correct alignment of short reads that can map to multiple locations on the genome. Advancements in the software have greatly addressed these problems and also with increase in sequencing read lengths have overcome the problem of multi mapping reads. A list of high-throughput sequence aligners has been maintained by EBI.
In cases where alignment of the eukaryotic mRNA transcript is done with a reference genome, a special handling is needed of the intervening intron sequences which are absent in mature mRNA. The aligners for short reads carry out an extra round of alignment for identification of splice junction by utilizing canonical splice site sequences and known intron splice site knowledge. The determination of intron splice junctions allows alignment of more reads to a reference genome by avoiding misalignment of reads across splice junctions or incorrectly elimination. This enables the improvement in accuracy of gene expression estimates and also allows the detection of isoform abundance changes which otherwise be lost during bulk analysis.
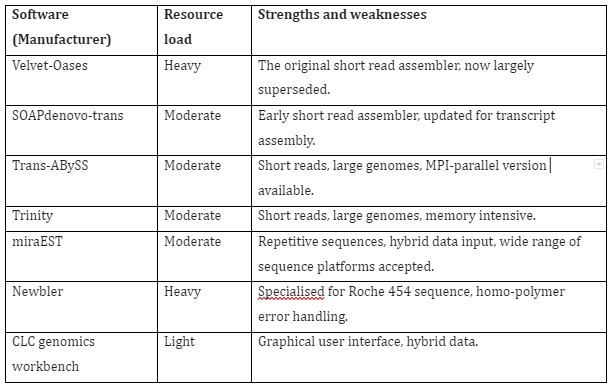
In case of de novo assembly, the sequence reads are aligned to one another in order to construct a full-length sequence of original RNA transcript without any reference genome. The challenges faced in this technique is the requirement of large computation resources in comparison to reference-based transcriptome analysis. Furthermore, additional gene variant or fragment validation and addition annotation of assembled transcripts is also required. The first metrics that described transcriptome assemblies like N50 were found to be incorrect and later on the evaluation methods were improved. The better evaluation of assembly completeness is the annotation-based methods like contig reciprocal best hit count. Once the assembly is completed de novo, then it can be used as a reference for sequence alignment methods and also for quantitative gene expression analysis. The softwares for de novo assembly are given in Table 2:
Table 2: RNA-Seq de novo assembly software
Quantification: The sequence alignment is quantified at gene, transcript or exon level. The most common output is the table of read counts meant for each feature that is given to the software like, for genes in a general feature format file. For example, HTseq software package can be used to quantify gene and exon read counts. The quantification at the level of transcript is quite complex and thus, it employed probabilistic methods to estimate the transcript isoform abundance from given short read information, for instance cufflinks program. The read that can align to multiple locations, they are needed to be removed or must be aligned to a single location or to a most probable location.
Some of the methods of quantification require exact alignment of the sequence reads to the reference genome. the kallisto method combines quantification and pseudoalignment in a single step that runs approximately two times faster than the comparable methods like tophat/cufflinks and also with less computational time and burden.
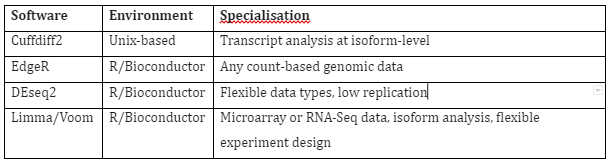
Differential expression: After the quantification of each transcript has been done and is available, then differential gene expression is measured by normalizing, modelling and statistical analysis of data. The software used for this step are tabulated in Table 3. The input of this softwares is mostly a table of genes and read counts, but some like cuffdiff, accept input as binary alignment map format read alignments. The final output as a result of these analysis is the list of gene with linked pairwise tests for differential expression amid treatments and the probability estimates of those differences.
Table 3: RNA-Seq differential gene expression software
Stage 3: Validation
The last stage is the validation of transcriptomic analysis. The validation is done through an independent technique like quantitative PCR (qPCR) which is detectable and assessable statistically. The measurement of gene expression is done against a defined standard for both control and sample genes. The functional validation of key genes is an essential requirement for post-transcriptome planning. The gene expression pattern that are observed may be linked to a phenotype proved with knock-down study in organism of interest.
Transcriptomics in Clinical Research
The RNA-based transcriptome analysis has potential to a wide set of application across various dimensions of human health that includes diagnosis, prognosis and even therapeutic selection. The application of these RNA-based quantification is due to advancement in technology and development of many bioinformatics tools and programs. The applications were further enhanced by evolution of next generation sequencing technologies which led to development of techniques like RNA-sequencing that has revolutionaries clinical research, as it provides deep knowledge of transcriptomes and identifies novel transcript variations.
Besides using an open platform technology, there are many important and potential advantages of RNA seq technologies over microarray gene expression analysis that includes dynamic range of expression analysis, quantification of single nucleotide variants (SNV)/insertions/deletions, determination of different isoforms of transcripts, splice variants and also it can be done on any species.
Some of the important applications in clinical research are explained below:
Research windows enabled by RNA-seq in Clinical Research
In RNA-seq, samples are sequenced which have billion of bases present across tens to hundreds of million of short reads (paired/unpaired). These large number of short reads are aligned with the help of bioinformatics tools to measure differential gene expression. It has opened up lots of new and dynamics clinical test environment. This is due to the following reasons:
Detection of underlying alternations in genome at the resolution of single nucleotide. It identifies alternations in expressed genomic regions.
Quantification of gene expression level and ability to identify variations not determined at genomic level that also includes the expression of alternative transcripts.
Open-platform technology, which has ability to quantify known or predefined RNA species and also got the competence to identify and quantify novel and rare RNA transcript variants in samples.
Dynamic range of transcript expression quantification as it can determine thousands of differentially expressed gene isoforms, detect germline variations and mutations, identify chimeric gene fusions and transcript variants.
Characterization of previously unidentified transcripts and distinct types of ncRNA, microRNAs (miRNAs), PIWI-interacting RNAs (piRNAs) and tRNAs.
All of these abilities have enabled the researchers to understand the reasons behind the disease state and associated phenotype.
Detecting aberrant transcription in human disease
The mRNA signature based assays are being integrated in the clinical management. These assays make use of many technological platforms for measuring mRNA expression of various multigene panels and it also have wider clinical applications. For instance, in breast cancer, as per the latest guidelines the use of multigene mRNA-based prognostic assay was supported in order to assist in treatment decisions, in combination with clinicopathological factors. Certainly, the oncotypeDx 21- gene expression assays were confirmed in a breast cancer study. Breast cancer gene expression signatures which were important clinically were compared using RNA-seq and microarray. The output reported a strong correlation for gene expression from the OncotypeDx and MammoPrint signatures across platforms. In another study, it was found that the RNA-seq outdo the microarray in characterizing the cancer transcriptomes and for clinical endpoint prediction.
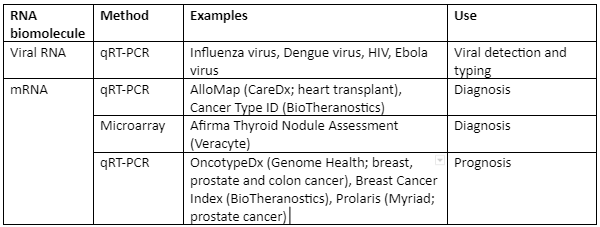
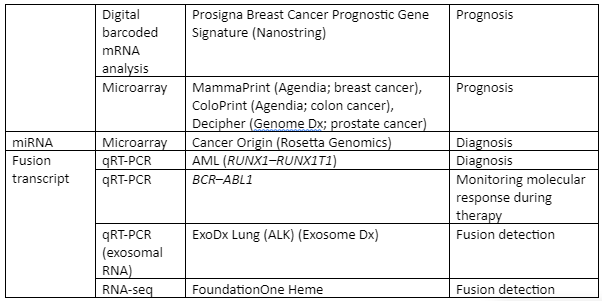
Some of the important examples of transcriptome analysis in human illness is given by Table 4:
Table: Transcriptome analysis in infectious diseases of human beings
RNA-seq for infectious disease diagnosis
RNA-based pathogen diagnostics: There are many clinically important RNA viruses which includes Ebola, HIV, West Nile, Hepatitis A,D and E, dengue, influenza, coxsaxkie and the severe acute respiratory syndrome (SARS) and Middle East respiratory syndrome (MERS) coronaviruses. For virus detection and typing, most commonly employed technique is qPCR. Recently, RNA-seq has been employed to directly detect influenza virus present in respiratory fluids and also other viral pathogens were detected in some cases. Transcriptome analysis has also been used to determine the origin and transmission of Ebola virus during 2014 outbreak. Furthermore, these RNA based techniques are also utilized for quasi-species (mixed allele population) assessment for HIV and hepatitis C and these analyses are essential in clinic in order to detect the drug-resistance mutation for therapy of patients.
Microbial exogenous small RNA: In human plasma, diversity of exogenous RNA has been identified which is indicating towards the relationship between microbiome and the host for food and environment. The importance of these exogenous RNA is still under research but it has been anticipated that they have a great promise in diagnostic process. There has always been extensive analysis and cataloguing of small RNA entities that are produced by pathogens and it will serve as a comprehensive database for reference of exogenous RNA signals that can become important in future clinical studies regarding infection. For instance the ex vivo study on Neisseria meningitidis infections that occur in human blood vessels has produced many small RNAs that are also found to be linked with bacteraemic infections. Similarly, there are extensive studies on Mycobacterium tuberculosis microRNAome that have given us with many important biomarkers that are currently been explored as a potential diagnostic marker and also can have application as a phenotype-genotype diagnostics.
Pathogen mRNA: Microbial mRNA measurement is a very beneficial marker of infection. In cases where infection level is low, by measuring the level of pathogen mRNA, infection can be detected.
Host RNA: As a result of an infection, there is a host response which is produced in the form of host mRNA signatures. With transcriptomic analysis, these signatures can be monitored and detected. For example, specific host immune factors like interferon beta 1 (IFNB1) interferon lambda 2 (IFNL2) and interferon lambda 3 (IFNL3) are upregulated as a result of genotype 3 HCV infection. Furthermore, microRNA-gene interaction that take place after the infection outbreak is also very useful as a potential diagnostic biomarker for specific type of infection. Also, it differentiate between active and latent infections, for instance, biomarkers are used to discriminate between active and latent M. Tuberculosis infection.
Conclusion
The transcriptome analysis has the ability to study gene expression at a very deep level. It has allowed the clinical researcher to utilize it in order to study human diseases in a better way. It has revolutionized clinical testing by detecting and identifying novel biomarkers for a wide range of diseases. But, still a great deal of work is needed to make transcriptomic analysis techniques more precise, user-friendly and have reproducibility.