Introduction
Ever since the beginning of the 21st century, we have seen technological advancements and the emergence of high-throughput ‘omics’ techniques like microarray and next-generation sequencing. These techniques have resulted in the generation of a large amount of data as they measure or sequence thousands of genes simultaneously. Thus, by a single experiment, these techniques have allowed us to identify the association of genes with phenotype. But to understand such an association, it is necessary to accurately interpret the data, which is quite challenging. Up till now, many tools and computational programs have been developed to understand the data and that have the ability to generate regulated gene expression profiles in simpler functional categories. Such type of analysis is termed functional enrichment analysis (FEA) or gene set analysis (GSA). The main aim of functional enrichment analysis is to find out biological annotations that are over-represented in a gene list w.r.t a reference background. These annotations are taken into account to understand biological processes and molecular mechanisms that are linked with understudy experimental conditions.
Functional Enrichment Analysis Types
Functional enrichment analysis or GSA is divided into three types:
- Singular Enrichment Analysis (SEA)
- Gene Set Enrichment Analysis (GSEA)
- Modular Enrichment Analysis (MEA)
The detail of these is given below:
Singular Enrichment Analysis (SEA)
Singular enrichment analysis determines the statistical significance of individual annotations i.e., functional or pathway terms, in a candidate genes list like a list of differentially expressed genes. In this conventional approach, preselected ‘interesting genes’ given by the user are taken and then enrichment of each annotation term is tested one by one in linear mode. Afterward, the enriched annotation terms that passed the enrichment P-value threshold are described in a tabular form ordered by enrichment probability (enriched P-value). The calculation of enriched P-value is formed by using statistical methods like Chi-square, Fisher’s exact test, hypergeometric distribution, and binomial probability.
The strategy and the results generated by SEA are quite simple and it is considered one of the efficient approaches to understand the meaning of huge gene lists that are generated by high-throughput technology.
Gene Set Enrichment Analysis (GSEA)
Gene Set Enrichment Analysis (GSEA) is a second class or type of GSA. It analyzes the gene distribution liked to a given term in the whole experimental setting with genes that are ranked on specific criteria like fold change. In this computational technique, a theoretically defined set of genes’ statistical significance having a consistent difference between two biological forms like phenotype is determined.
In a typical workflow of GSEA, it takes into account the experiments having genome-wide expression profiles from given samples that belong to two different classes. Afterward, genes are ranked depending upon their association between their expression and class distinction based on any appropriate metric.
We are provided with a defined set of genes S and the main objective of GSEA is to find that the members of S are either randomly distributed throughout or are present at the top or bottom. It is anticipated that the gene sets having phenotypic distinction will show the latter distribution. The three main elements in the GSEA method are:
- Enrichment score (ES) calculation: In this step, ES is calculated that shows the degree of over-representation of set S at the extremes of the whole ranked list (L). the calculation of the score is done by walking down the list L, i.e., increasing the running-sum statistic after a gene in S is present and decreasing it when genes not in S are encountered. The increment magnitude depends on the association of the gene with phenotype. The enrichment score is the maximum deviation from zero encountered in the random walk; corresponding to a weighted Kolmogorov–Smirnov-like statistic.
- ES Significance Level Estimation: In this step, the nominal P-value which represents the statistical significance of ES is estimated by an empirical phenotype-based permutation test protocol that maintains the complex association structure of gene expression data. Precisely, the phenotype labels are permuted and the ES of the gene set for the permuted data are recomputed, which produces a null distribution for the ES. The empirical, nominal P-value of the observed ES is then calculated relative to this null distribution. this permutation of class labels helps in preserving the gene-gene correlation and therefore, gives us a more suitable biological assessment of importance than world be gained by permuting genes.
- Adjustment for Multiple Hypothesis Testing: When we are evaluating an entire database of gene sets, then, the estimated significance level is adjusted for multiple hypothesis testing. Firstly, the ES is normalized for each gene set to represent the size of the set, giving us the normalized enriched score (NES). After that, the amount of false-positive is controlled by calculating the false discovery rate (FDR) corresponding to each NES.
The overview of GSEA is given by following figure 1:
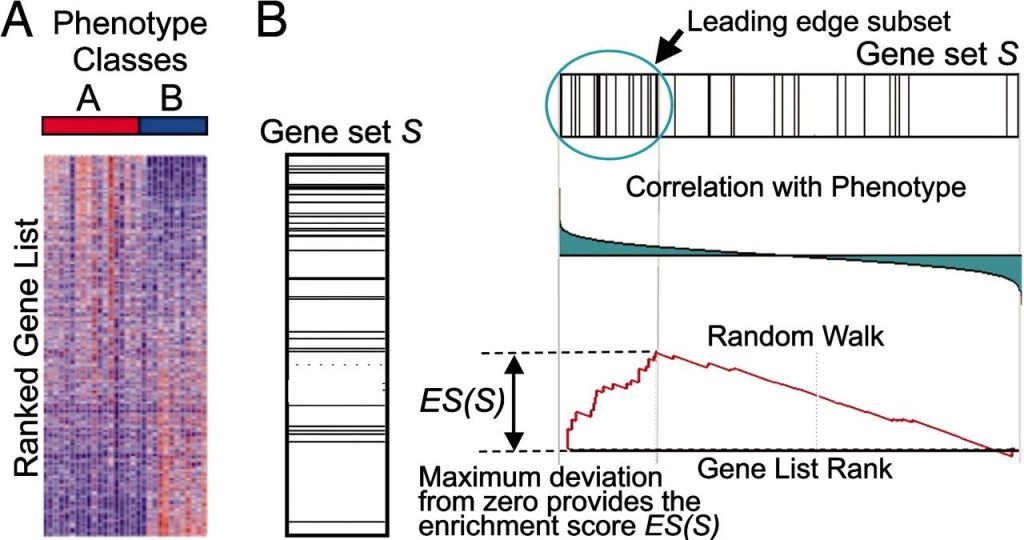
Figure 1: Overview of Gene Set Enrichment Analysis. (A) An expression data set is sorted by the relationship with phenotype, the corresponding heat map, and the “gene tags,” i.e., the position of genes from a set S within the sorted list. (B) The plot of the running sum for S in the data set, including the location of the maximum enrichment score (ES) and the leading-edge subset.
Modular Enrichment Analysis (MEA)
These analysis algorithms take into account the innate relationships among annotations to define or specify sets of related terms and then their significance is evaluated by SEA or GSEA. MEA gets the basic enrichment calculation from SEA and integrates network discovery algorithms by considering a term-term relationship which is the key benefit for the researcher. Because sometimes the joint terms have a unique biological meaning which cannot be deduced from isolated terms. correspondingly, when heterogeneous annotation content is used, there is a high redundancy of annotation terms and also, they represent a strong interrelationship for the similar biological process. The development of these relationships allows us to understand the true nature of biology while data mining.
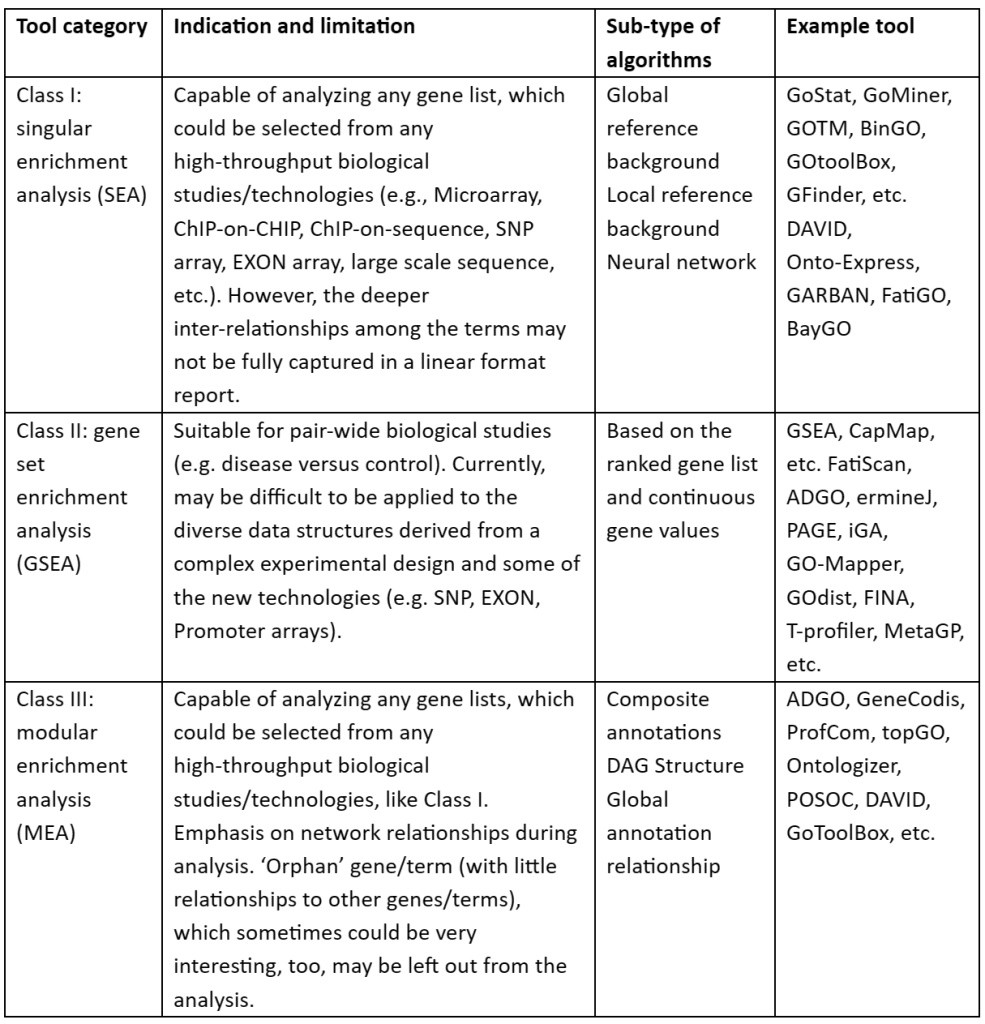
Table 2: Classes of Functional enrichment analysis
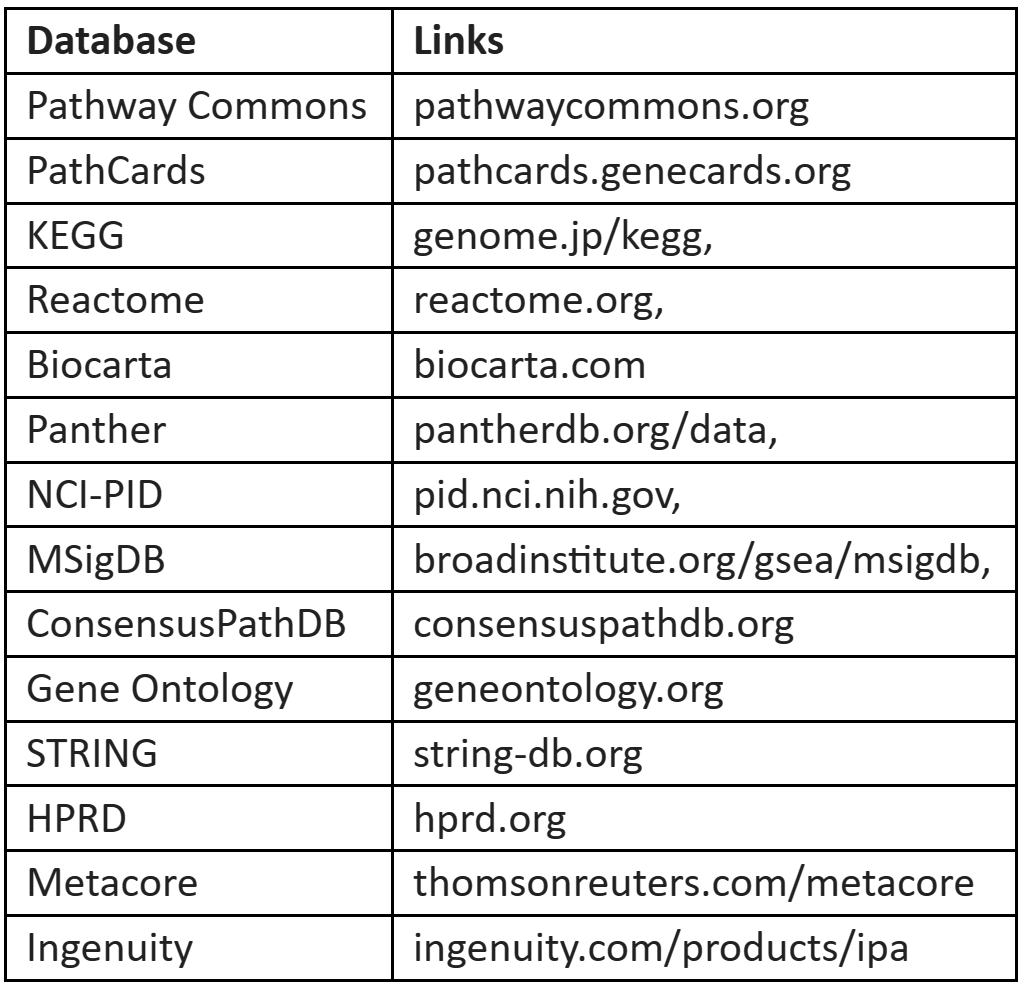
The databases for the selection of gene sets are given in Table 3:
Table 3: Databases for gene sets selection
Categorization of Functional Enrichment tools
The most important tools of functional enrichment analysis can be classified into two categories:
- Over-representation analysis (ORA)
- Functional Class Scoring (FCS)
Over-representation analysis
ORA is a natural extension of single-gene analysis and it is one of the popularly used gene set analysis approaches. ORA is available through many computational tools because of its simplicity, ease of operation, and well-understood underlying statistical model. ORA makes use of a list of L genes which are predicted as differentially expressed with the single-gene analysis technique.
In this approach, differentially expressed genes (DEGs) that meet a certain threshold are queried against curated pathways (gene sets). Then, a statistical test is done to determine whether the number of DEGs affiliated with a specific gene set is higher than the predicted value by random chance, as estimated by comparing it to a background gene list. The ORA computational tools can either be software packages or web servers and they can utilize more than one statistical test (like the chi-square test, Fischer exact test, etc.)
When using ORA for differential gene expression, it is not suitable to use whole-genome as background, as in any type of tissue, most of the genes are not expressed, and therefore, they cannot be detected and classified as DEGs. A better strategy is to use the list of genes as the background which have genes that are detected at the assay level and have the chances to be detected as DEGs. Background gene list of the whole genome can be used in cases where we are studying genetic variations but it becomes problematic when the ratio of genes to be measured is small as in the case of single-cell RNA-seq.
Functional Class Scoring (FCS)
In ORA, the main assumption was that the genes are independent and they have an equal effect on a biological process. This assumption simplifies the modeling but it is not biologically accurate as in some cases genes and proteins act in groups. Another limitation of ORA is that it makes use of only differential expressed genes which are resulted mostly due to a p-value cutoff and ignoring the quantitative values of the genes. To resolve this limitation, FCS was developed. In FCS methods, the main objective is to utilize all the expression matrix information to sort out the enrichment issues without depending upon the biologically inaccurate assumptions. Thus, the FACS takes into account the expression matrix for all the genes having a specific measure of gene expression rather than simply taking a gene list having differential expression. They used this to determine the enrichment of the sets of genes.
The FCS methods can be further classified into two categories that are univariate and multivariate methods. In univariate FCS methods:
- Calculation of a gene score for each gene by using each row of the expression matrix.
- Calculation of gene set score by using gene scores for each set of genes.
- Assessment of the significance of gene set scores
- Reporting of differentially enriched gene sets.
In the case of the multivariate FCS method, direct calculation of gene set score is done from the expression matrix.
Besides these two main categories, some of the tools are topology-based pathway methods.
Topology-based Pathway
All the genes in a given pathway do not have an equally significant role. The information and knowledge of pathway topology like gene product interactions are helpful in the quantification of gene importance to pathway activity. The accuracy of enrichment analysis is enhanced with topology information.
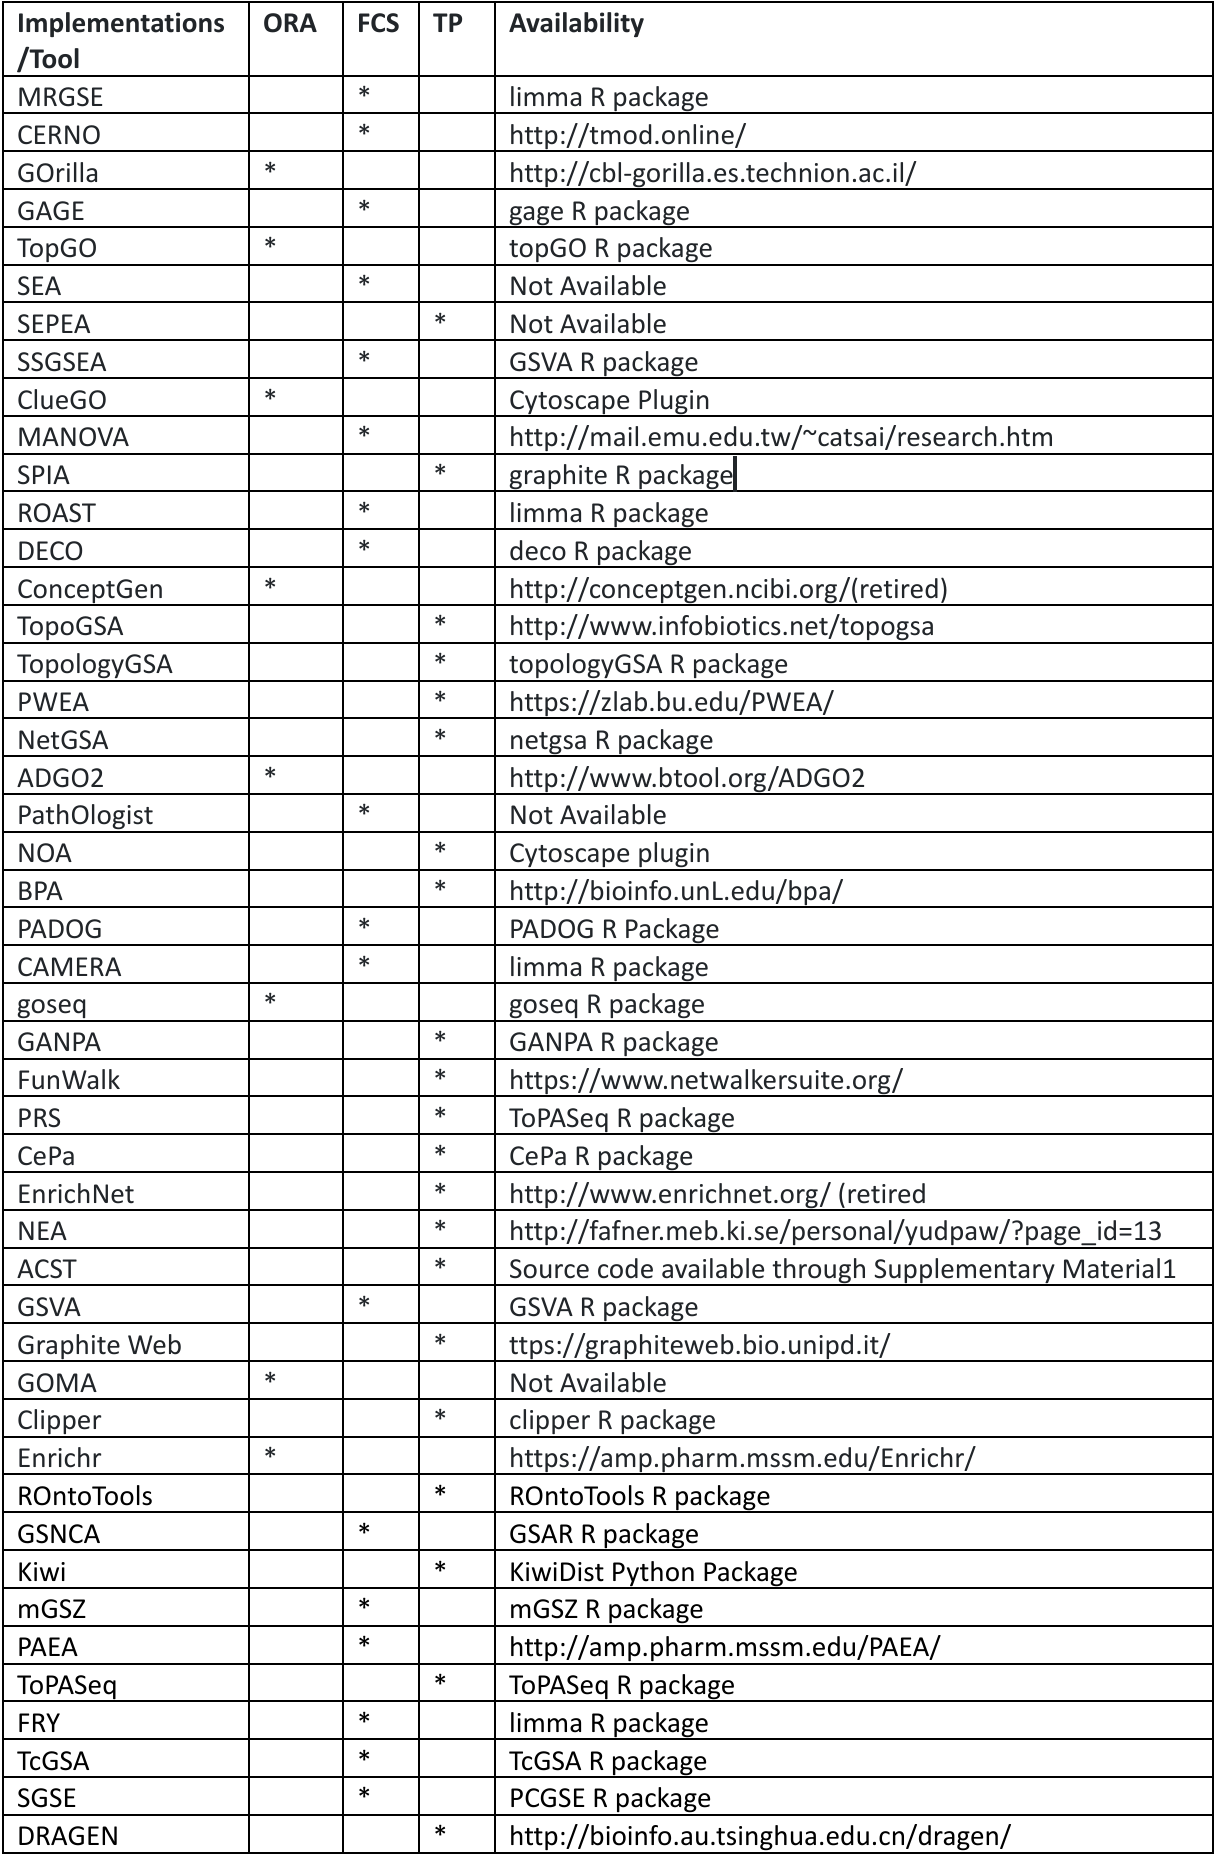
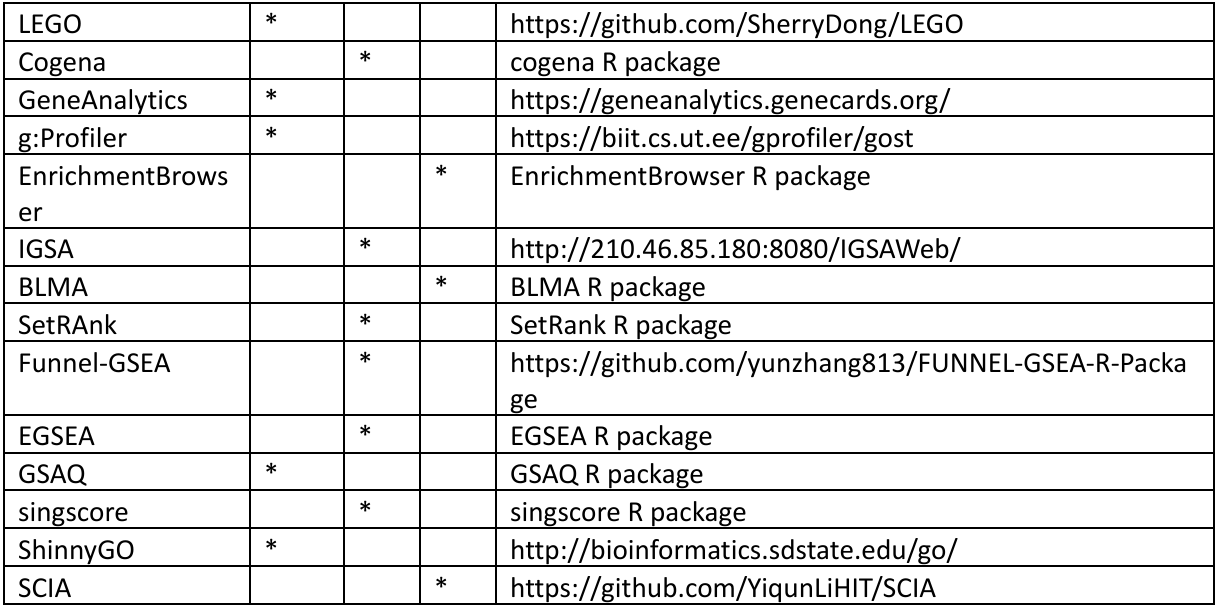
Table 4: Functional Enrichment analysis tools with their categorization
Essential Databases of Functional Enrichment analysis
In functional enrichment analysis, two databases are quite essential. These are Gene Ontology (GO) and Kyoto Encyclopedia of Genes and Genomes (KEGG). These databases emerged around the time when the first eukaryotic genome was released publicly and they have a single main objective i.e., to systematically catalog the function of genes and proteins.
Gene Ontology (GO)
The cornerstone of functional enrichment analysis is the GO. It initiates discoveries by knowledge-based computational analysis of biological data produced from large assays. GO can select or reject hypotheses and deductions related to biology by determining the annotated function which is over-represented in a given gene set of interest.
Gene Ontology (GO) defines our knowledge and information of the biological realm concerning three features:
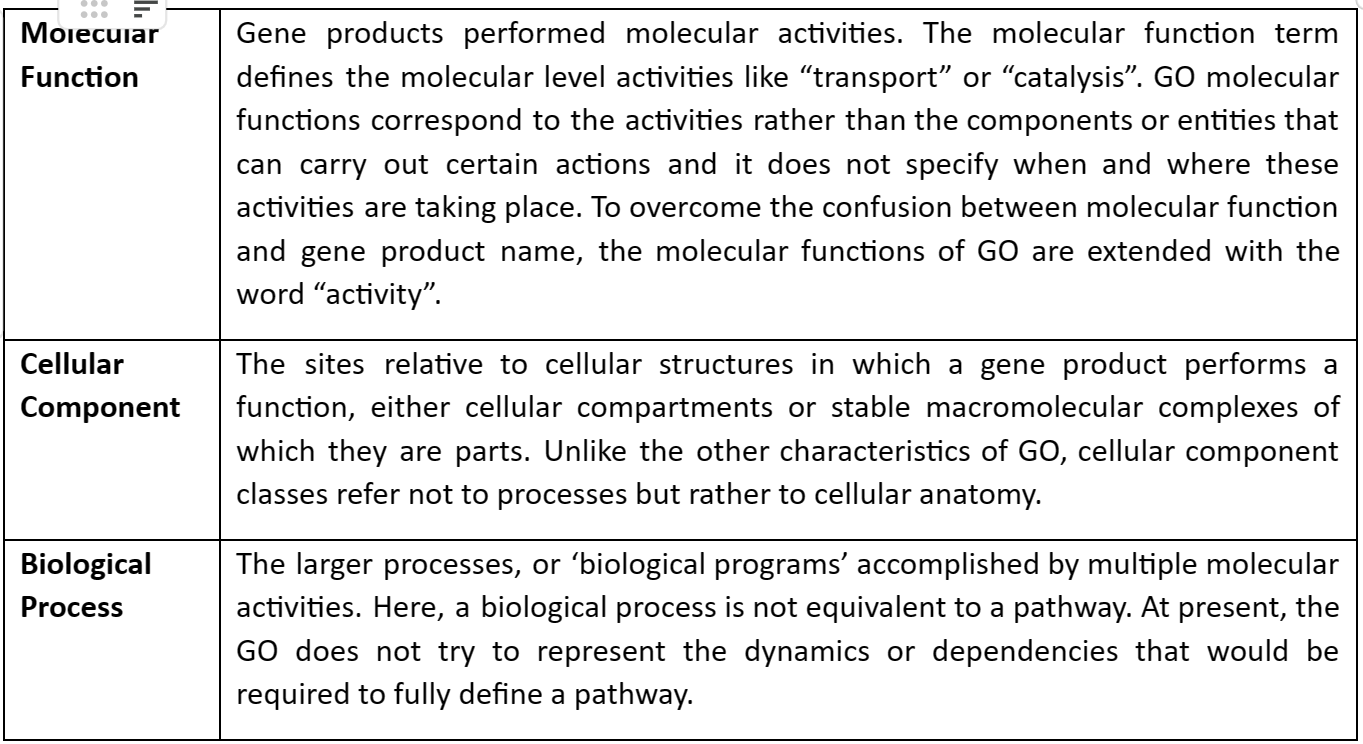
The GO structure is explained with a graph in which each GO term is a node and edges between the nodes represent the relationship between the GO terms. GO is mostly hierarchical with the ‘recent child’ term being more specialized as compared to ‘former parent’ terms. The graph of GO is given by following figure 2:
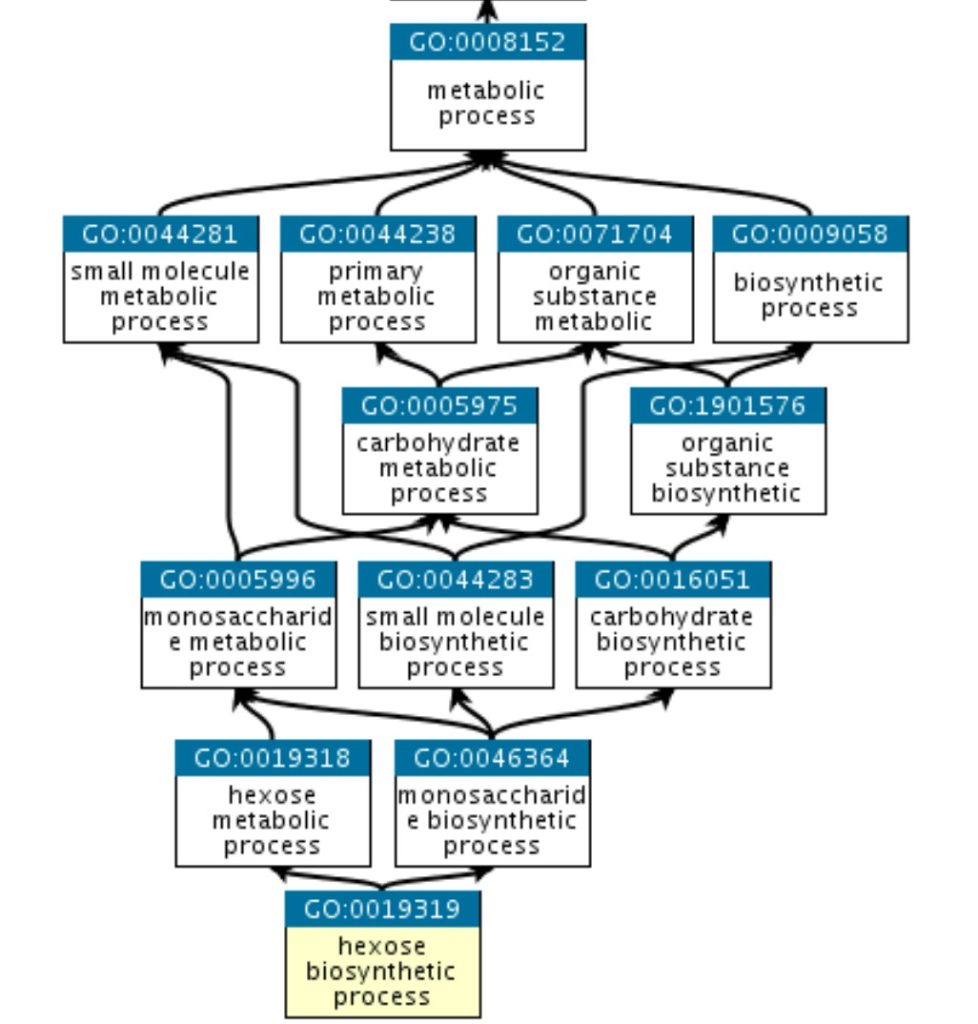
Figure 2: Graph of Gene Ontology terms
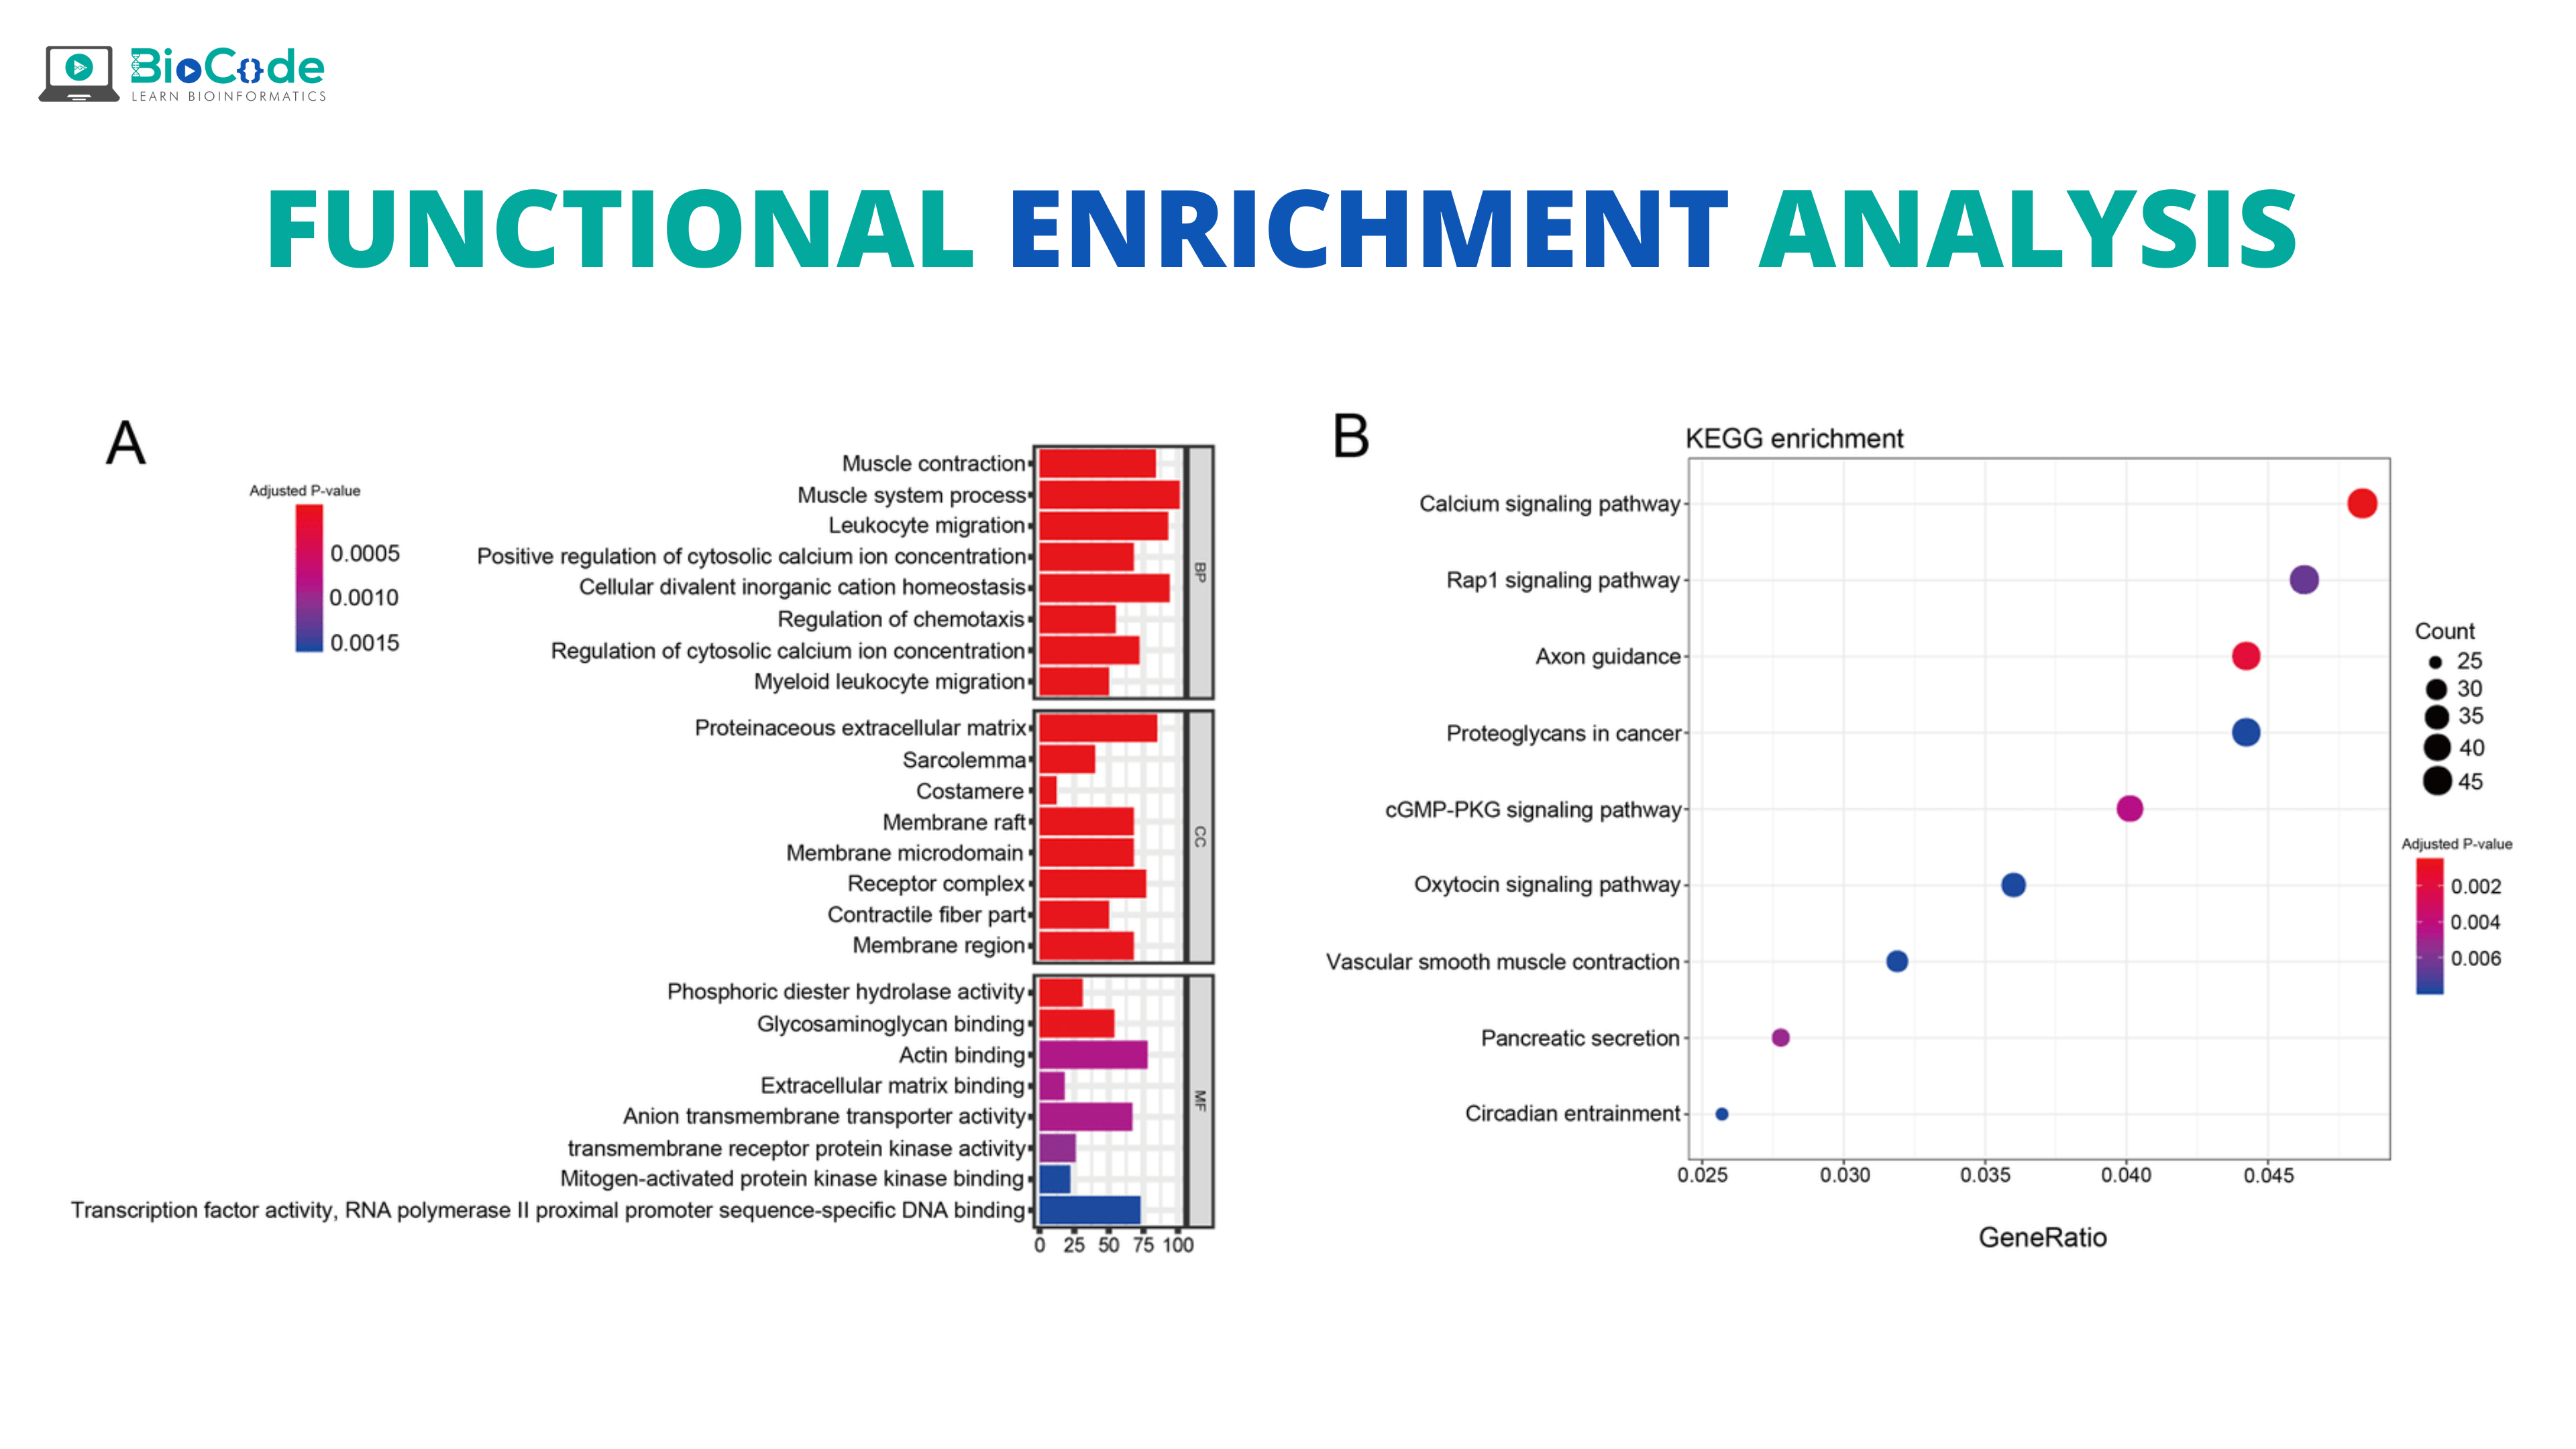
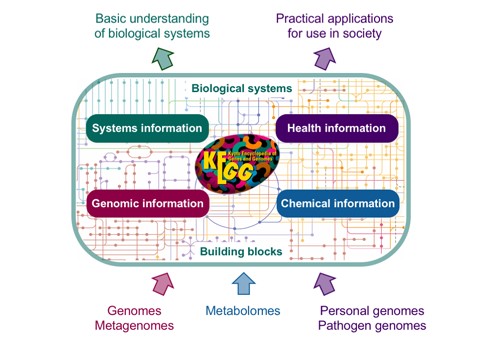
Kyoto Encyclopedia of Genes and Genomes (KEGG)
KEGG is a functional enrichment analysis database resource that allows us to understand high-level functions and the importance of biological systems from cells to the organism and the ecosystem. It is a computer-based resource of a biological system that has molecular building blocks of proteins and genes i.e., genomic knowledge and chemical information. This information is integrated with knowledge of molecular wiring diagrams of interaction, reaction, and relation networks. It also has information about diseases and drugs that cause disturbances to the biological system.
Conclusion
Functional enrichment analysis is playing a very crucial role in the analysis of the large bulk of data produced by high-throughput techniques. It has allowed us to assign a function to previously unknown genes and also it has helped in the elucidation of many important biological pathways. There are a number of tools available for functional enrichment analysis but still, each of them has a shortcoming, and still there is a need for gold standard tool in functional enrichment analysis.