Introduction:
The turn of the millennium has brought many high-throughput ‘omics’ techniques which have resulted in the generation of a huge amount of data. These techniques have enabled us to quantify thousands of genes at the same time and identify many significant linkages and associations through a single experiment. Interpretation and analysis of this high-throughput data are quite difficult. So, to understand the data many tools are established which have the ability to transform regulated gene expression profiles into simplified functional classes or categories. The functional categories are mostly biochemical or signaling pathways taken from knowledge present in literature, thus it is named functional enrichment analysis. The validity of functional enrichment analysis depends upon rigorous statistical methods and accurate and up-to-date gene functional annotations.
Functional enrichment analysis is employed in biomedicine for gene expression data analysis to detect disease and drug mechanisms such as molecular function, biological processes and crucial biological pathways that are affected as a result of gene expression alterations according to conditions.
Workflow of Enrichment Analysis
Any biological process is characterized by a set of genes and the principle of enrichment analysis is that if the biological process is anomalous in a study, then the genes that are co-functioning should have a higher (enriched) capability to be selected as an appropriate group by high-throughput scanning (HTS) techniques. This approach and principle have transformed the analysis of a large number of genes from single genes to appropriate gene-group-based analysis. As this approach results in identifying a group of relevant genes involved in a biological pathway or process, it allows the researchers to identify the correct pathway of the biological phenomena of interest.
The enrichment analysis can be done quantitatively by using some of the most popular statistical methods like Chi-square, and Fischer’s exact test, hypergeometric distribution and binomial probability. Besides this, annotation databases like gene ontology (GO) are very suitable for collecting biological information in a format of gene-to-annotation for HTS for enrichment analysis. GO maps a large number of genes of interest in a list systematically and associates them to a specific annotation term and then statistical analysis is applied to determine the enriched gene members for each of the defined annotation terms by comparison of the output to the reference or control background. In this way, enriched members are identified from hundreds or thousands of annotated terms in a rapid way. The enriched annotation terms which are linked with a large list of genes will give us important insight that will enable the researcher to comprehend the underlying biological functions behind a gene list.
Several bioinformatics tools have been developed for enrichment analysis. Every tool has its own distinctive features and capabilities. Besides their features, every tool works in three major steps or stages (illustrated in figure 1):
Data support: It is defined as the data support provided at the backend by the annotation databases.
Data mining: It is composed of different types of algorithms and statistics for the analysis of a given gene list.
Result output: It is the representation of output in a particular interface depending upon the type of tool used.
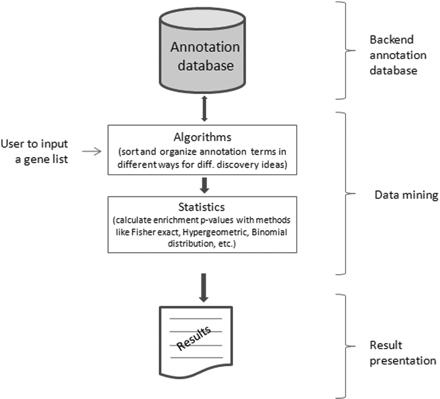
Figure 1: The workflow of a typical enrichment tool for analysis
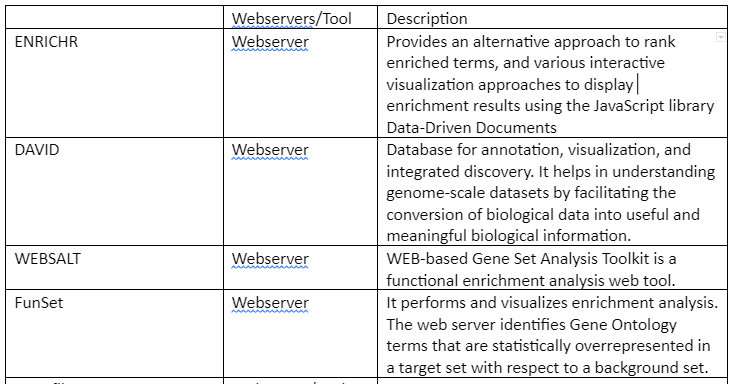
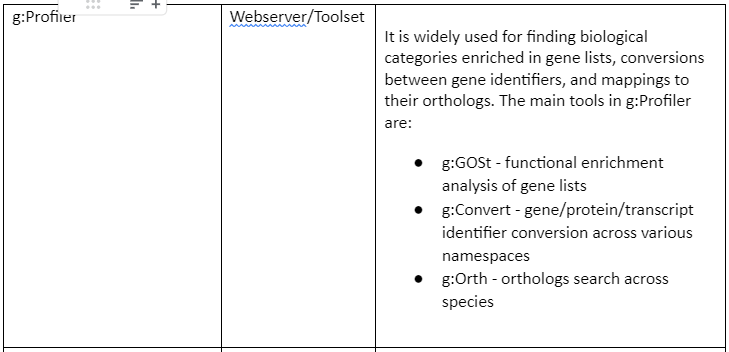
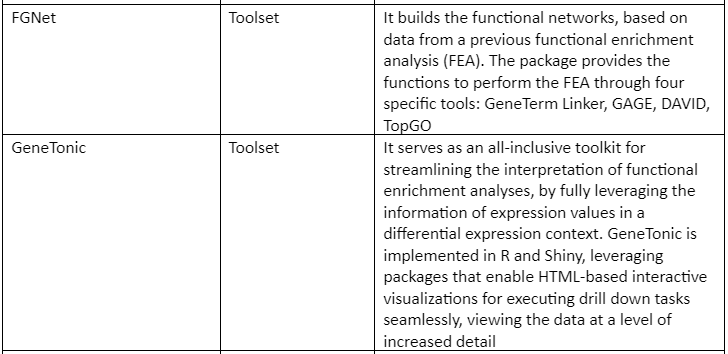
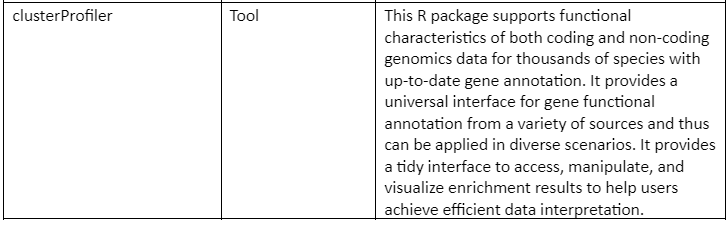
Some of the web servers and tools (mostly R packages) are tabulated in table 1:
Here we will explain the general workflow of pathway enrichment analysis, important steps are given:
Step 1: Use of omics data to define a gene list of interest
Any type of omics experiment results in measuring the gene activity in the given research. This results in the generation of the raw dataset that needs computational processing like normalization and scoring functions for the identification of the genes of interest. Thus, for any type of omics data, pre-processing steps are necessary to have the gene list of interest. For example, during a gene expression analysis study you obtain a list of differentially expressed genes that can be used as input for functional enrichment analysis.
Step 2: Enrichment analysis
In the second step, a required statistical technique is used for the identification of pathways enriched in the gene list as produced in step 1. From the given dataset, all the pathways are tested for enrichment in the gene list. This helps in the identification of enriched pathways.
Step 3: Visualization and interpretation of pathway enrichment analysis results
The visualization allows the identification of main biological themes and pathways. It enables us to have an in-depth study and experimental evaluation.
The pathway analysis is illustrated in figure 2:
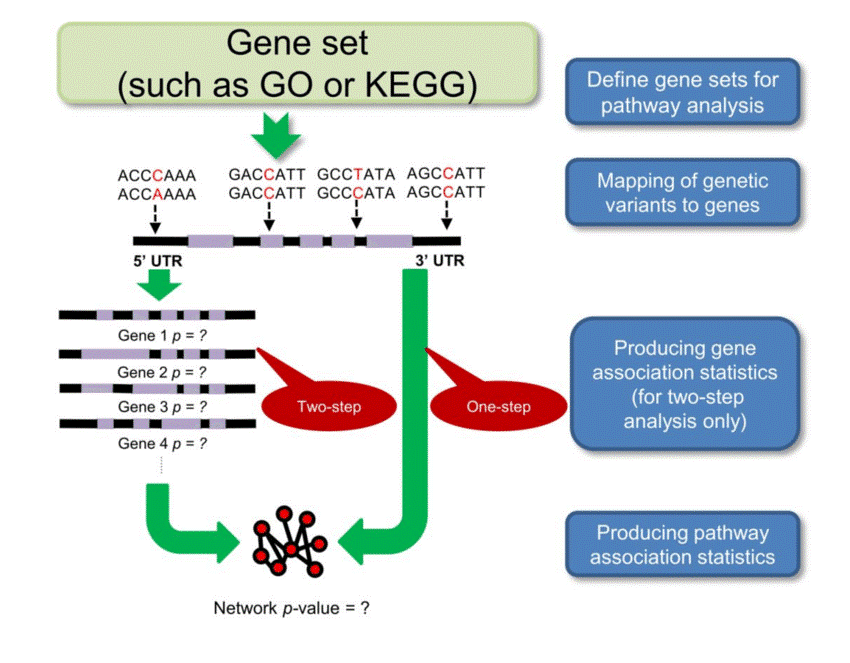
Figure 2: General workflow of pathway analysis
For enrichment analysis, two databases are most frequently used, that is:
Gene Ontology (GO)
Kyoto Encyclopedia of Genes and Genomes (KEGG)
GO is mostly used for gene annotation. These two databases emerged at the time around the first eukaryotic genomes release and their objective is to systematically catalog the function of genes and proteins.
The detail of both these databases is given in the next sections.
Gene Ontology
The functional annotations of proteins, RNAs, or other gene products promote the growth of drug development, analysis of diseases, gene enrichment analysis, and other domains. In the present era, advancements in HTS techniques have allowed producing a large amount of data at a small cost, and now the focus has been shifted to analyzing data in the form of a unified functional description scheme. GO is a comprehensive paradigm that addresses this challenge and aims to determine and describe the properties of gene products and play a role in their function prediction. GO is the most widely utilized functional annotation tool and it is continuously updated.
GO is made up of three ontologies:
Molecular functional ontology (MFO): it aims to describe the elemental activities of a single gene product at the molecular level (that is, catalysis and binding)
biological process ontology (BPO): It aims to capture the beginning and the ending of relevant functioning of cohesive living units: cells, tissues, organs, and organisms.
cellular component ontology (CCO): It aims to describe the cellular parts and their extracellular environments.
Each ontology consists of a special set of ontological terms named GO terms, which are ordered in a hierarchy or also known as the directed acyclic graph (DAG). The DAG can be produced from ontology files by using moderate scripts like R. Matlab and Python.
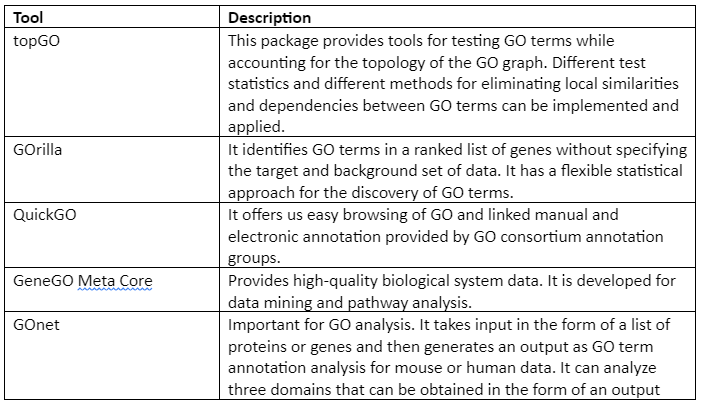
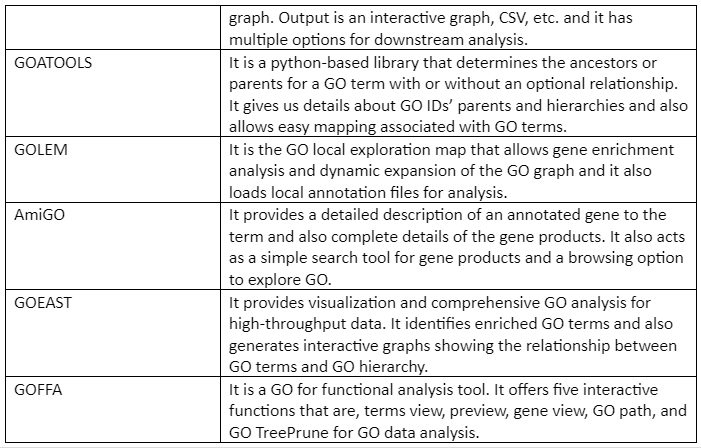
Important GO analysis tools and software are given in Table 2:
Table 2: List of GO analysis tools
Kyoto Encyclopedia of Genes and Genomes (KEGG) Pathway
KEGG database allows us to understand the utilities and complex functions of a biological system, like cells, organisms, and the ecosystem from the level of the genome to molecular information. KEGG is the computation form of the biological system that is composed of molecular building blocks of genomic information i.e., genes and proteins and chemical information. Both of these are interlinked and integrated which allows us to understand gene functions, disease knowledge, drug information, etc.
The KEGG pathway databases are viewed as a set of ortholog group tables that includes main pathways, sub-category pathway, and secondary pathways. All of these pathways are encoded by a set of genes present on chromosomes and thus this knowledge enables us to predict gene function. Thus, the KEGG pathway is one of the choice techniques in enrichment analysis platforms. KEGG pathway analysis provides us with two types of advantages:
Reducing the complexity by grouping thousands of DEG from HTS in just several hundred pathways
Ability to identify the most impacted pathway which increases the explanatory power for the experiment under given conditions.
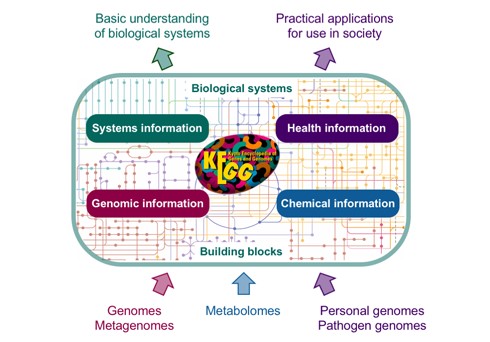
Figure 4: Illustration of KEGG applications
The KEGG Database
As mentioned, KEGG is an integrated database resource that has sixteen databases as given in table 3. These databases are classified into system information, genomic information, chemical information, and health information databases differentiated by color coding of web pages.
Table 3: KEGG databases
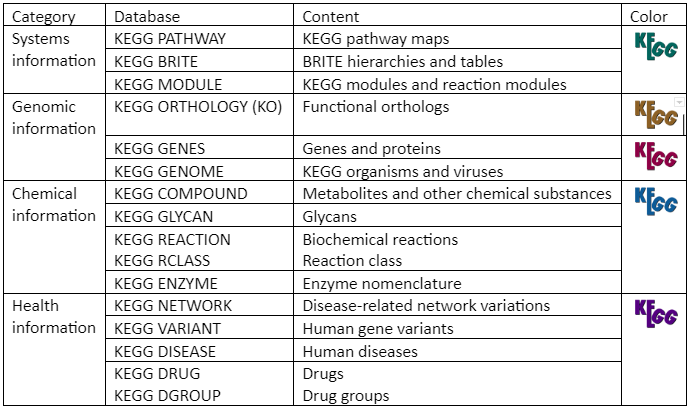
The chemical information category is collectively referred as KEGG LIGAND
The health information category combined with drug labels is called KEGG MEDICUS
KEGG Molecular Networks
It is the most unique data object as it gives us an insight into molecular interaction, relation, and reaction networks showing systemic functions from cell to organism. This experimental information is taken from literature and then arranged in the following form:
Pathway map – in KEGG PATHWAY
Brite hierarchy and table – in KEGG BRITE
Membership (logical expression) – in KEGG MODULE
Membership (simple list) – in KEGG DISEASE
All of these databases provide us with reference knowledge for analysis and interpretation of genome and high-throughput datasets by using KEGG mapping. KEGG mapping is defined as the method to map molecular products like proteins, genes, small molecules, etc. to molecular interaction/reaction/relation networks (KEGG pathway maps, BRITE hierarchies, and KEGG modules). This process is not only an enrichment procedure but it allows the generation of the new data set. From the initial stages of the KEGG project, the main aim was to produce organism-specific pathways with set operations among manually annotated genome data and manually produced pathway maps. Therefore, KEGG mapping has allowed extending the KEGG knowledge base through its set operations. Besides this, it helps assist and integrate users’ datasets. In KEGG mapping, three basic operations are present:
Pathway mapping
Brite mapping
Module mapping
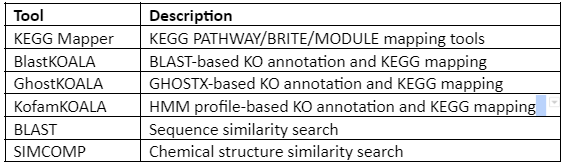
the KEGG analysis tools are given in the following Table:
Conclusion
Enrichment analysis has played an important role in the interpretation of complex genomic datasets produced through HTS technologies. These are playing a crucial role in genome annotation and pathway analysis by using Gene Ontology and the KEGG pathway respectively. Many new tools are being developed to assist in the analysis, the choice of tool depends on the experiment setting. But still, more research is needed as the available literature on these analyses is quite scarce, and to establish a thorough understanding, more reviews are needed.