Understanding Open Chromatin Regions (OCr)
The DNA is a highly condensed molecule that reaches its final form after going through three hierarchies i.e., nucleosome, chromatin, and chromosomes. Among these hierarchies, chromatin is important as it changes into euchromatin and heterochromatin forms, depending upon transcription signals and they are very crucial players in gene expression.
Open Chromatin Regions (OCr) are the areas that can be contacted by DNA regulatory elements and are also important for the normal physiological activities of human beings. The structure of chromatin consists of nucleosomes which normally consist of octamers of histone surrounded by ~167bp of DNA sequence. In OCs, nucleosomes are depleted while in the neighboring region of chromatin, they are present in perfect arrays. These OCs help us to identify cancers, tumor heterogeneity, and prediction of potential markers. Many approaches have been developed for the accessibility of chromatin including ATAC-Sequencing.
What is ATAC-Seq?
The Assay of Transposase Accessible Chromatin sequencing has gained quite popular since its release in 2013. As the name describes, ATAC-Seq is used for accessibility across the genome without any prior knowledge of regulatory elements. This feature makes it a powerful epigenetic tool. It is very useful for chromatin accessibility, complex diseases gene regulation, activation of T-Cell, Binding of Transcription factors, embryonic development, and cancer.
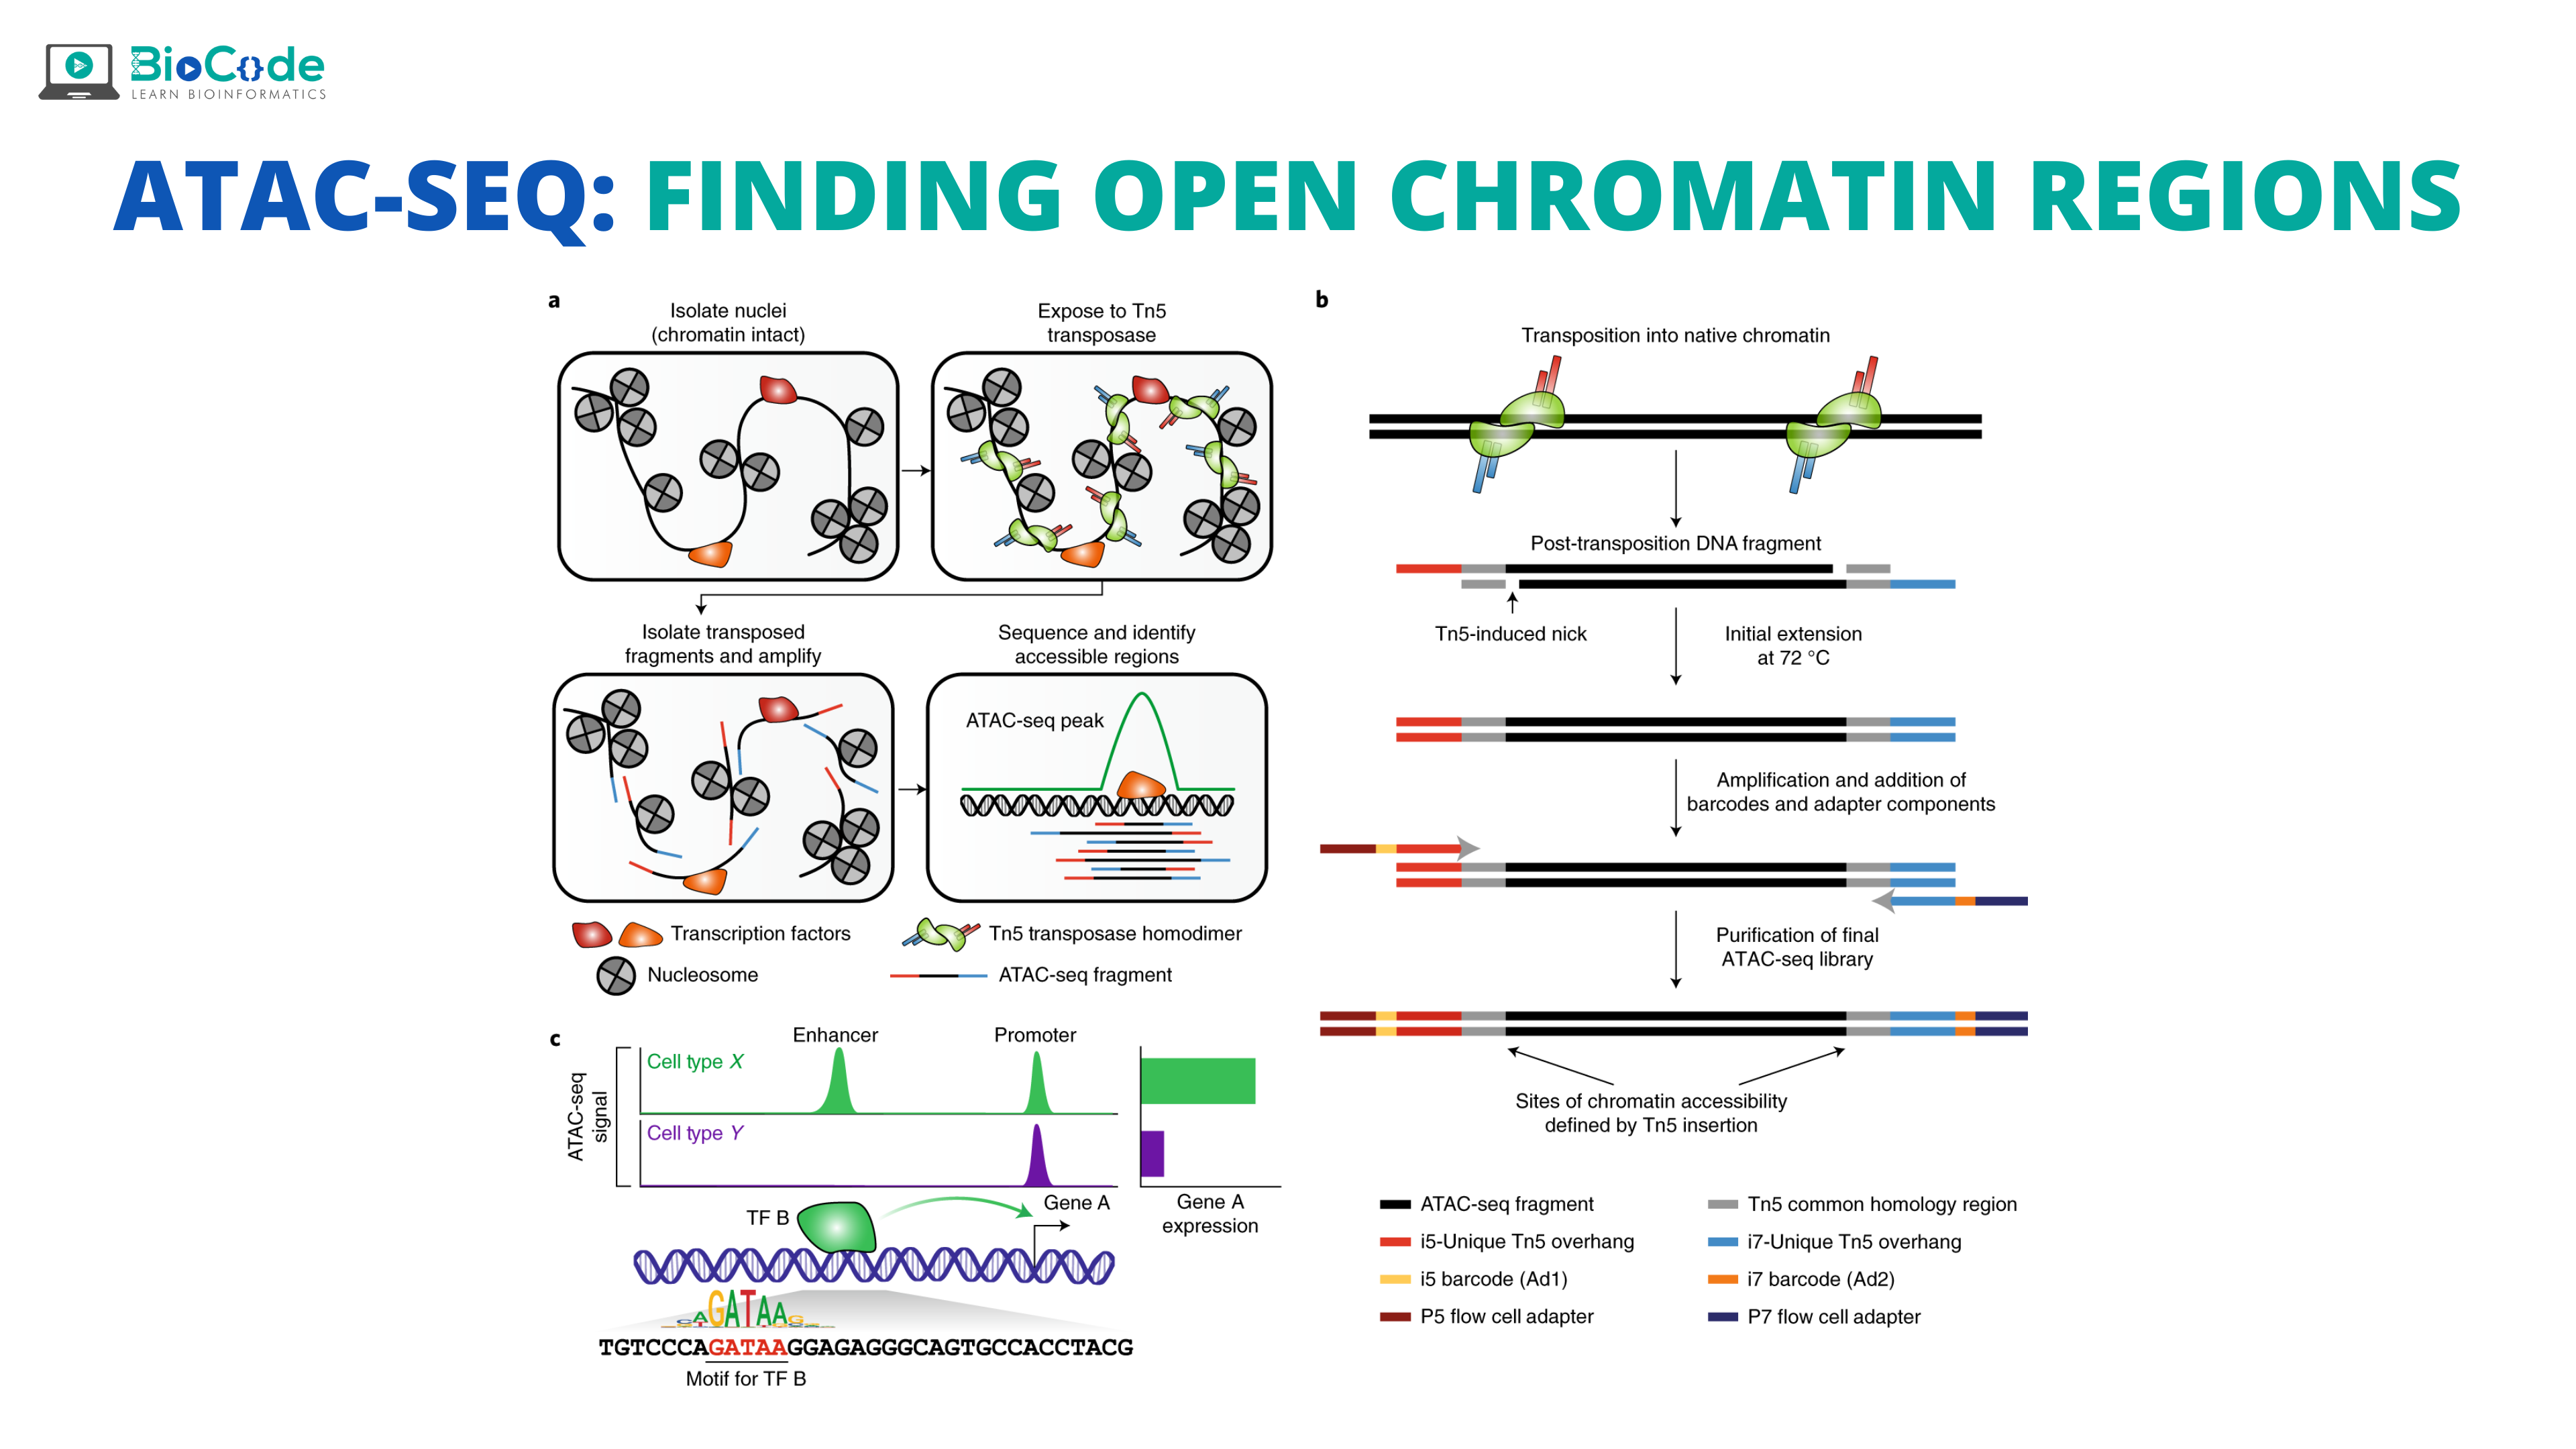
Working of ATAC-Seq
In ATAC-Seq, the open chromatin region is cut open by exposing genomic DNA to a transposase Tn5 that is genetically engineered. This results in creating a staggard nick of about 9 bp in OC and then, it ligates, at this region, high throughput sequencing adaptors. So, the nick will be repaired as the 9 bp region will be duplicated, and then finally paired-end sequencing will be done which will allow a unique alignment rate of these open regions.
Steps involved in ATAC-Seq
In ATAC-Seq four important steps are involved. These include:
Pre-Analysis
Core Analysis
Advanced Analysis
Integration with multi-omics Data
The details of these steps are mentioned below:
Pre-analysis
This step generally involves quality control (QC) and alignment. In pre-alignment quality control, Fast QC is utilized. It is the visualization of base quality scores, GC content, distribution of sequence length, duplication level of sequences, overrepresentation of k-mers, and primer or adaptors contamination in sequencing data. Generally, a high base quality score having sequencing reads with little drop at the 3’ end is acceptable. Also, it must be observed that no deviation from anticipated GC content takes place. Also, all the sample batches in the same experiment must have homogenous metrics. In addition to this, low-quality bases and contaminated adapter sequences can be eliminated by utilizing tools like Skewer, cutadapt, trimmomatic, and Adapter Remover. After reading trimming Fast QC can be carried out again to validate whether low-quality bases and adapters have been removed or not.
After trimming, the sequence reads are then mapped according to a reference genome. The efficient and fast pair-end read aligners mostly employed are BWA-MEM and Bowtie 2. Both this software allow overhangs present in sequence reads which enhance the unique rate of mapping. In a successful ATAC seq experimentation, the unique rate of mapping is typically above 80%. In mammals, for OC detection and other analysis, the least recommended number of mapped reads is 50 million.
After alignment, post-alignment processing and quality control are done. Software like Picard and SAM-tools are used to know the elementary metrics of aligned BAM files which include distribution of fragment size, percentage of duplicate reads, unique map reads, etc. Also, improperly paired reads and low mapping quality reads must be removed. The elimination of the mitochondrial genome (as it lacks chromatin packaging) and ENCODE blacklisted regions must also be ensured. This step ensures improved OC detection and lacks false-positive results.
In addition to the above-mentioned quality control metrics, other parameters are also evaluated during ATAC- seq, this includes:
Generation of fragment size distribution plot having decreasing and somewhat periodical peaks consistent with the nucleosome-free region (NFR).
The fragments which are in NFR are anticipated to be enriched around the transcription start site (TSS) while the fragments which are bonded with nucleosomes are depleted at TSS, but a slight enrichment is expected to present at the flanking region around TSS.
It is estimated that reads should shift +4 and -5 bp for plus (positive) and minus (negative) strands respectively. This occurs due to 9 bp duplication due to Tn5 transposase nick and its DNA repair.
These mentioned QC steps and analysis are integrated with the help of MultiOC for a user-friendly, interactive, and aggregated view. The use of required software and tool is a major consideration. The following timeline is found to work in the best way:
FQC ➔ trimmomatic ➔BWA-MEM ➔ ATAC- Seq QC
Core Analysis
It is the second main step in ATAC-seq. In ATAC seq data analysis, the major part is the identification of accessible regions which are also referred to as peaks and this peak calling provides the basis for advanced analysis. The default software known as the peak caller used is MACS2 of ENCODE ATAC-Seq pipeline. There is only a single peak caller which is specifically designed for ATAC-Seq while all the others are taken from ChIP-Seq and DNase-seq.
Typically, ATAC-Seq peak callers can be divided into two groups or categories i.e.
Count-Based: They employ distinctive statistical methodologies to compare read distribution present in candidate regions to any random background. Among these, Poisson distribution is assumed by MACS2, SICER, and HOMER while zero-inflated binomial distribution is assumed by ZINBA. Also, kernel density estimation is utilized by F-Seq and PeakDEck and SPP lacks any assumption related to fragment distribution. It should be considered that tools like F-Seq and ZINBA are not actively updated, so they must be utilized with caution. Generally, these methods are easy to interpret and so are widely used.
Shape-Based: these tools are currently not being employed in ATAC-Seq but they make use of read density profile information either directly or indirectly and it is suggested that they have improved peak calling in ChIP-seq. In this category, PICS uses fragment positions without counts, and every candidate region measures enrichment score. Similarly, PolyaPeak uses peak calling by statistics which describes peak shape while CLC uses a Gaussian filter from positive and negative peaks to determine peak shape.
The exclusive peak caller tool utilized is HMMRATAC which has a semi-supervised, three-state hidden Markov model (HMM). It enables the simultaneous segmentation of the genome into high signal OCr, moderate signal with nucleosomes region, and very low signal with background regions. No doubt HMMRATAC is computationally complex but it has better performance than tools like MACS2, F-Seq, etc. Also, this exclusive tool gives additional information about the nucleosome position.
Other considerations while peak calling includes dealing with Tn5 cleavage bias and biological replicates. Tn5 can produce bias due to its preference for binding which depends upon GC content. So it needs to be taken into account and adjusted while peak calling. Secondly, biological replicates can cause an increase in reproducibility and also a decrease in false-positive peaks. Biological replicates can be introduced in an experiment by the use of mixture models.
In addition to this, tools that create a narrow peak to form broad peaks are thought to be preferable and meaningful. These include MACS2, SICER, and HOMER. But, up till now, no benchmark tool has been associated with the peak calling of ATAC-Seq.
Advanced Analysis
ATAC-Seq shows us many dimensions of transcriptional regulation. In this major step, interpretation is done at four distinct levels i.e., peak, motif, TF footprint, and nucleosome. But like in peak calling, limited tools are exclusively designed for ATAC-Seq.
Peak:
For peaks interpretation, Peak differential analysis and Peak annotation are done. In peak differential analysis, a consensus peak is found, which is normalized and then several fragments in these regions are counted which in the end are compared statistically with other conditions. This can be done either manually or with the help of tools like consensus peak or sliding window-based tools.
In consensus peak-based tools, they depend upon RNA-seq differential expression (DE) analysis packages. Therefore, all of them need biological replicates for dispersion estimation as they assume negative binomial (NB) distribution. These analysis packages include DESeq, DESeq2, or edgeR. Also, it is recommended that to overcome the issue of false-positive differential peak calling, all the samples are pooled for consensus peaks. This is the default in the case of tools like HOMER but on the other hand, DBChIP and DiffBind obtain consensus peak through union operations or intersection. These intersection operations will not take into account some samples or even condition-specific peaks while union operations will give more False-positive results.
The approaches of sliding windows do not need already made peak sets. Alternatively, they take into account all the windows in the binned genome. They yield a large amount of false-positive results and need tight filtering and control of the false discovery rate (FDR). It is anticipated that this approach is unbiased but it is very difficult to control FDR. Some of the tools include PePr, ChLPDiff, DiffReps, and saw.
Although in the latest studies it is assumed that ATAC-Seq has NB distributions like RNA Seq data. But there is no exclusive tool available for shape-based differential analysis of ATAC-Seq data.
The second dimension is peak annotation. After the peaks are obtained, it is important to annotate them as it will allow us to relate chromatin accessibility with the regulation of genes. This is done through regulatory elements or the nearest gene. Peak annotation enables us to have a biological insight and known functionality, helping in more research. The tools involved include the most widely used ChIPpeakAnno and ChIPseeker for labeling peaks to their specific genomic feature. After this, functional enrichment analysis can also be done.
Motifs:
No doubt that the peak annotation gives us a functional insight but it does not give us information about the underlying pathway. OCr affects the rate of gene transcription with the help of TFs. Transcription Factors are facilitators as they recognize specific sequences of DNA and bind to them. The site at which they bind is known as the Transcription factor binding site (TFBS) while the sequence is known as the motif. In human beings, almost 1600 TFs are present and more than half of them have motifs that are obtained either computationally or experimentally. For TF binding, chromatin needs to be accessible while there are some TFs that can bind to nucleosomal DNA which is not quite accessible.
To know the information of motif, motif database and scanning are done. Important and popular databases are given in following table 1:
Table 1: A motif database
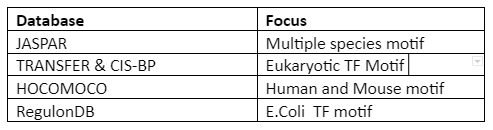
There is no central database and anomalies can appear due to the type of software used for motif discovery and experiments performed.
The next is the motif activity and enrichment analysis which compares the frequency and position of the motif in every peak to a random background. Different tools use different tests for determining motif frequency, for instance, HOMER and MEME-AME use hypergeometric tests and rank-sum tests respectively. Also, MEME-CentriMo finds out the enriched motif near the peaks.
The motif displacement score which is the ratio of the motif occurrence in a small window (150 bp) to occur in a large radius (1500 bp) from each peak center can be generated with the help of DAStk. This MD score is compared through a Z-test to other distinct conditions. All methods employ a different type of statistical test to determine the motif frequency in peak regions. Also, TFBS is associated with both the TF activity and also an indicator (not always) of the presence of OCr. The TFBS can be calculated by fragment count. These tools include ChromVAR, DiffTF, etc. All these tools determine TFBS indirectly from the sequence present in peaks. But chances of false-positive results are quite high as all the motifs of TFs are not identified and also many TFs can have the same motifs.
TF Footprint:
It is another way to know the regulation of TFs. The footprint is referred to as a pattern in ATAC-Seq where after TF binding To DNA results in the prevention of Tn5 cleavage. This results in relative depletion in OCr. So, this bound TFs footprint can be used to recreate the gene regulation network for some samples. But there are many difficulties in footprinting analysis which includes:
Shifting of raw reads to a pre=processing step to know 9bp duplication, this is helpful to identify accurate footprint.
Footprinting is difficult both computationally and experimentally due to the weak signal of TFs binding and high preference for Tn5 binding.
In ATAC-Seq footprinting analysis, only a few tools have been utilized without any evaluation. Generally, footprinting tools can be classified into two categories. These include de novo tools and motif-centric tools. De novo tools can predict almost all footprint sites as per a typical pattern of footprint (peak-dip-peak). Then, these regions are matched with known motifs and are also able to identify novel motifs. On the other hand, motif-centric methods need the input of preceding TFBS and then distinguish between them through supervised and unsupervised methods.
Nucleosome
Nucleosomes affect the binding of TF by changing the accessibility of chromatin. In a standard library of ATAC-sequencing, the fragments which are longer have nucleosome-associated regions. To determine where nucleosome is enriched, tools are developed but in ATAC-Seq, it is difficult to detect nucleosome as the read coverage goes over the OCr. The tools used for this purpose include iNPS, PuFFIN, NucTools and DANPOS2 which were developed for MNase-Seq, but after nucleosome-associated fragment filtering, can be applied to ATAC- Seq. Exclusive tools include HMMRATAC and NucleoATAC which are more useful than the rest.
Integration with multi-omics Data
In addition to data analysis of ATAC-Seq, scientists are interested to integrate it into other high throughput technologies like ChIP-seq and RNA-Seq. This will enable us to understand gene regulation in a better way. ATAC-Seq is quite probable to be integrated into ChIP-seq, as ATAC-seq peaks overlap with ChIP-seq but they are quite broader. So, both of them together can help to identify OCr and TFBS in a precise and reliable manner. On the other hand, ATAC-seq integration with RNA-seq will also enhance the accuracy, quality, and quantity of finding OCr.
The whole process is given by following Figure 1:
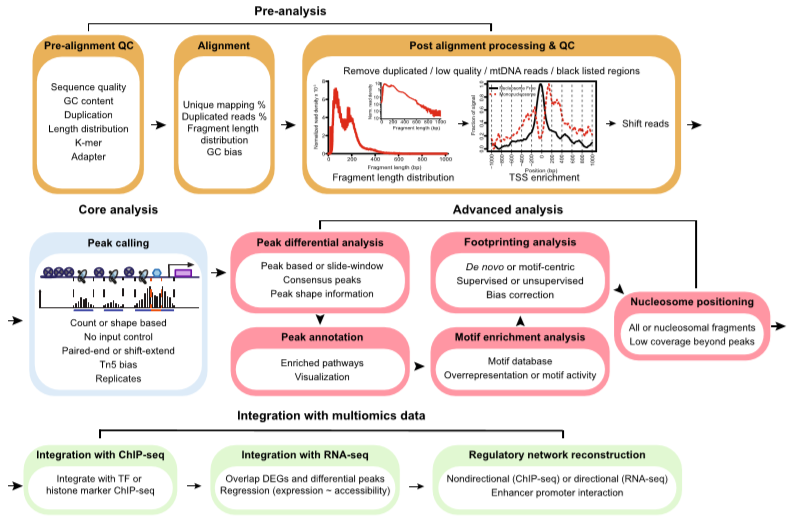
Figure 1: Four Steps involved in ATAC-Seq (source: Yan F., 2020)
Advantages of ATAC-Seq and Limitations
The advantages are:
Simple, efficient and robust technique due to Tn5 transposase hyperactivity and need only 500-50,000 cells.
Highly sensitive and specific which makes it superior to techniques like FAIRE-seq.
No stringent size selection is needed for library preparation. This also allows it to recognize nucleosome positions.
The limitations include:
Only a few exclusive tools are available for ATAC-Seq which limits its efficiency and robustness.
Many false-positive results, so high-quality control must be ensured.
Applications of ATAC-Seq
The applications of ATAC-Seq includes:
- Mapping of Nucleosome
- Transcription Factor Binding site analysis
- Identification of Novel Enhancer
- Epigenetic analysis
- Discovery of new biomarkers
- Regulation analysis of specific cell type
- Understanding disease-associated regulatory mechanism