Introduction
The present century is an era of technology and information technology. These advancements have led to many high-throughput sequencing technologies including RNA- sequencing (RNA-seq). The main task in these techniques is computational and statistical analysis. One of the challenges faced in data analysis is the alignment of sequence reads to the reference genome for inferring the expression level of genes. Specifically in RNA-seq, it is quite difficult to align short sequence reads accurately and efficiently to the original transcript to get the required knowledge.
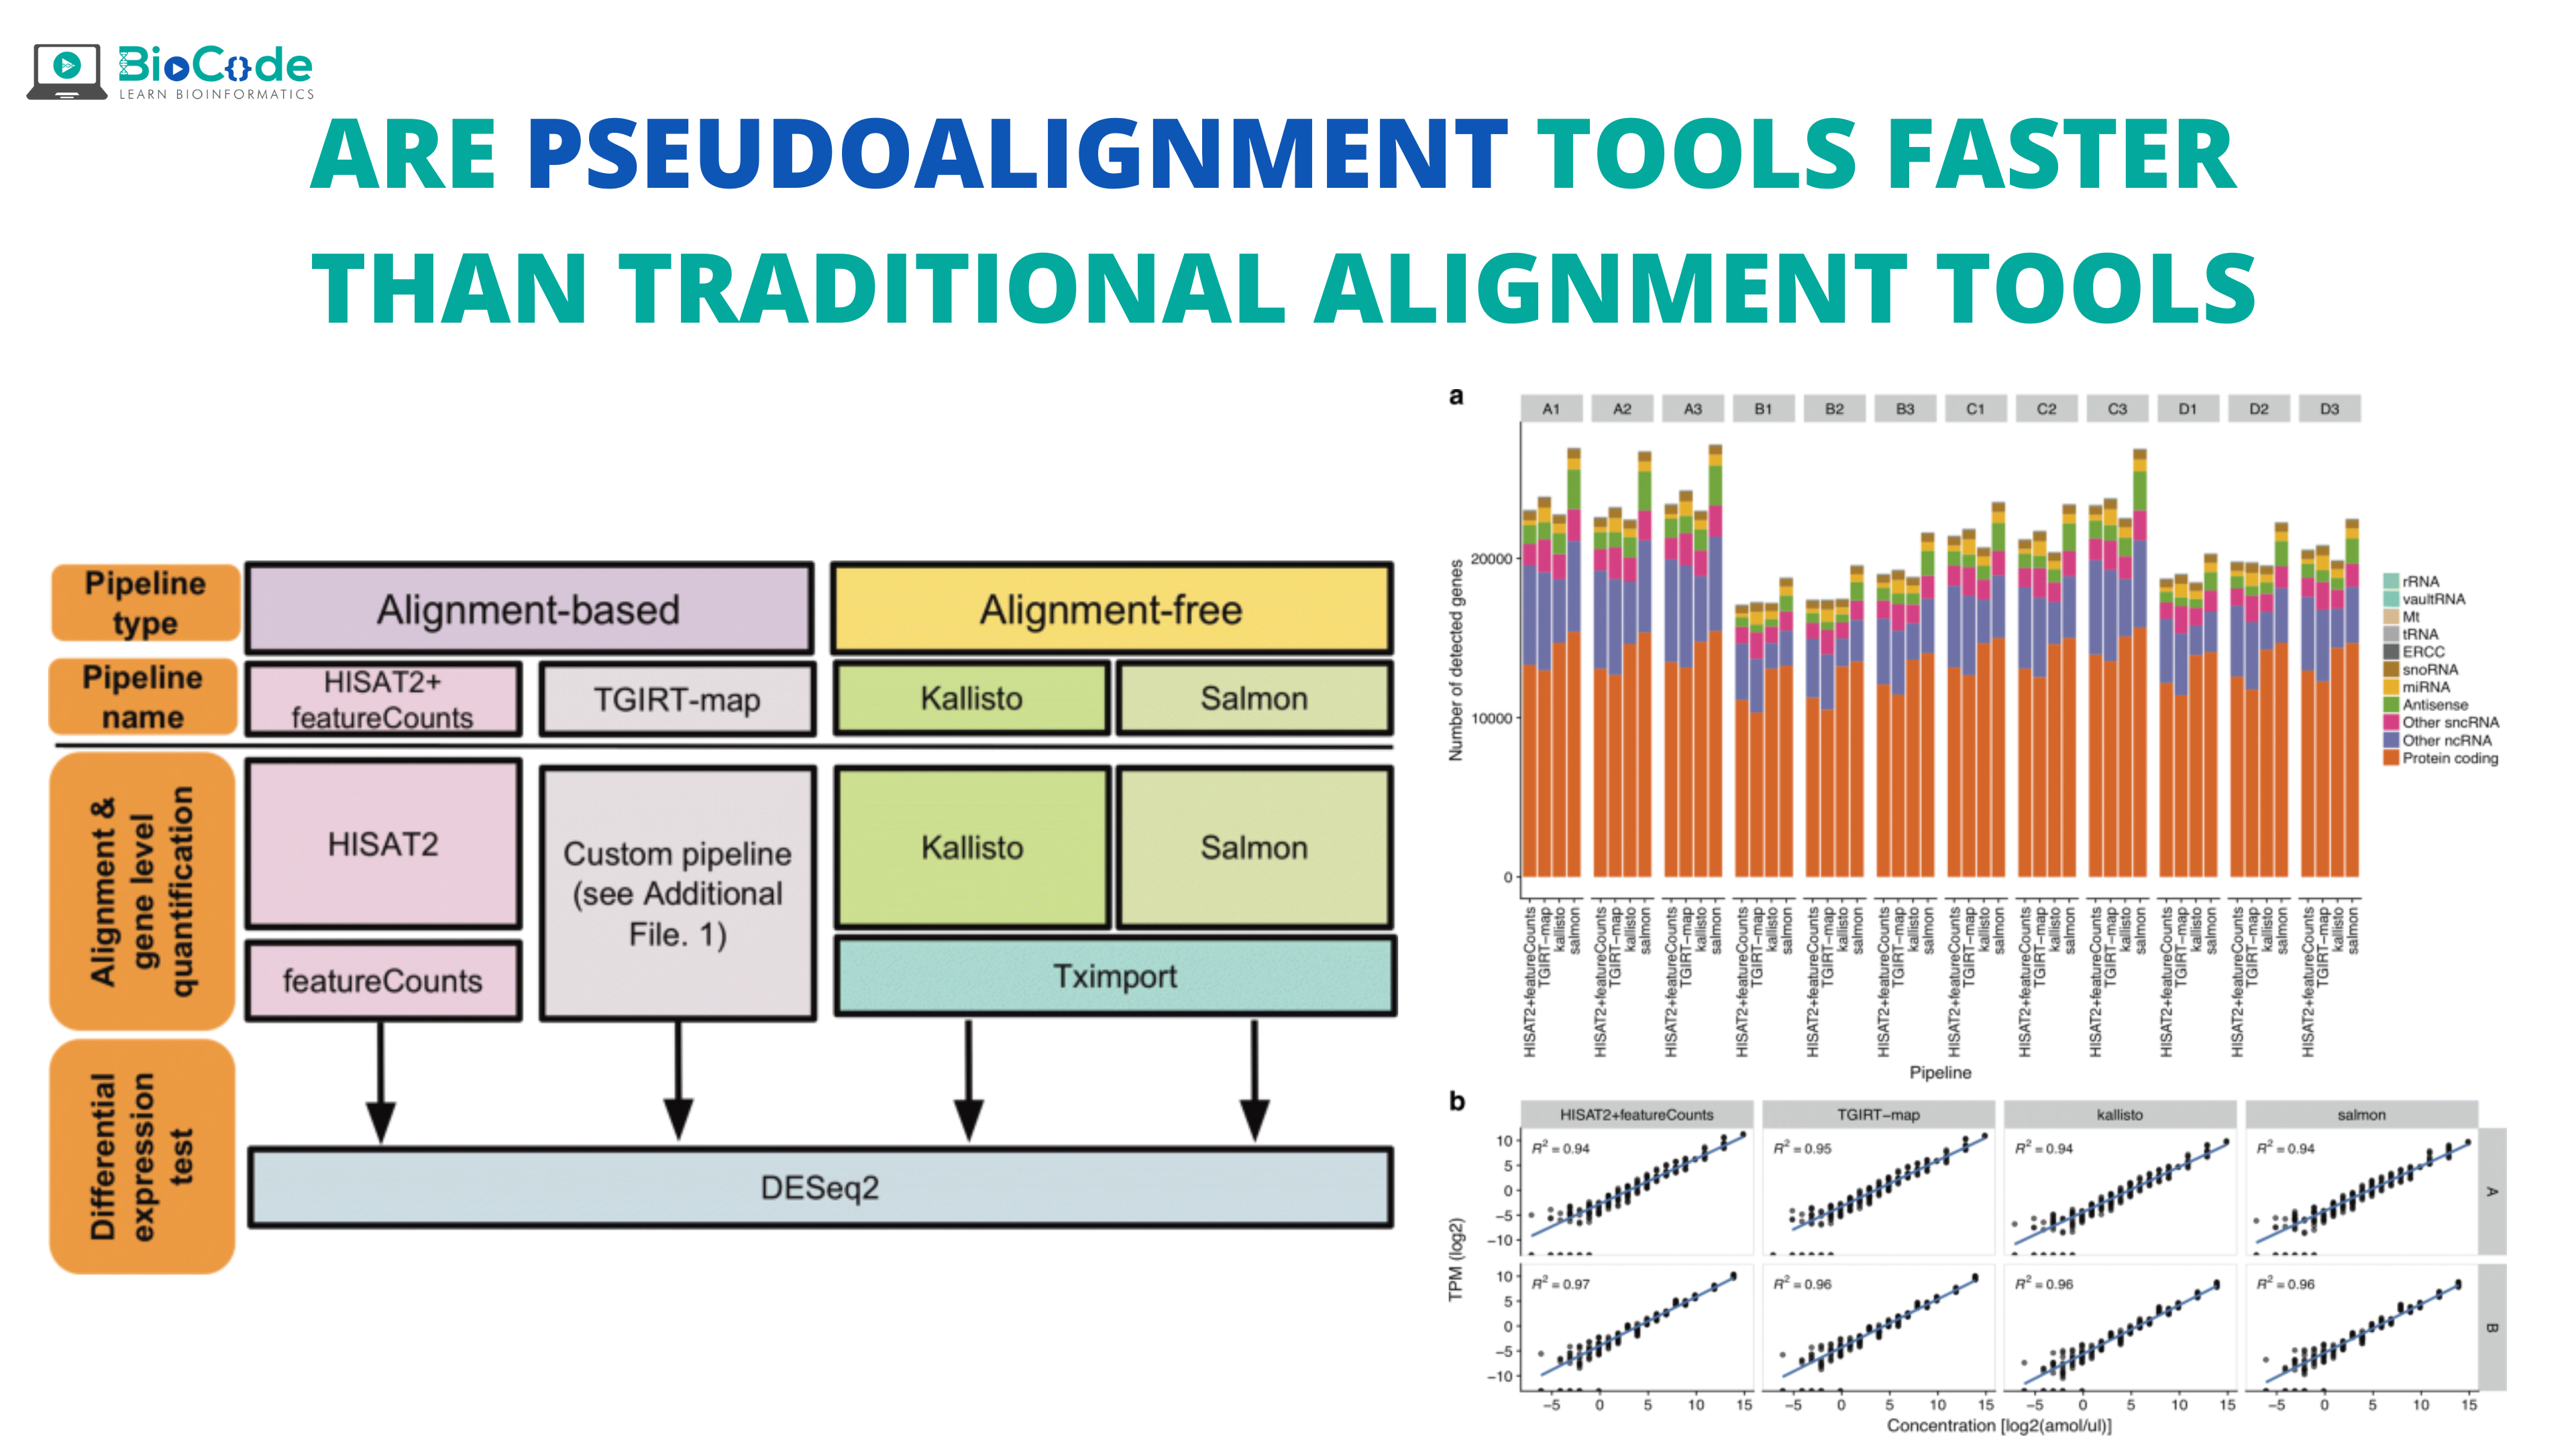
The alignment step can be done in through two means:
- Traditional alignment tools: In these methods, the sequence reads are aligned to a reference genome in such a way that the relative gene expression levels are determined at annotated gene loci. These methods are quite simple but they are quite time-consuming and computationally complex, even though aligners are continuously developed and updated, and also there are more than 60 aligners available.
- Pseudoalignment Tools: These are also known as the alignment-free transcript quantification tools that are k-mer-based counting algorithms. These tools work by breaking down the sequence reads into k-mers and then carrying out fast matches based on compatibility with pre-indexed transcript databases. These are very fast and efficient pipelines in comparison to alignment-based tools.
In this article, we will consider what makes pseudoaligners faster than the traditional alignment tools. But first, a brief overview of pseudoalignment is given in the next section.
Pseudoalignment
The pseudoalignment tools were developed initially for the context of RNA sequencing experiments. Pseudoalignment can be defined as an efficient k-mer based algorithm that employs a de Bruijn Graph of the reference database for the identification of potential matches for a query sequence without aligning the query to reference sequences. The most common tool for pseudoalignment is kallisto and here we will understand pseudoalignment with the help of kallisto.
When a read is pseudoaligned to a set of the transcript, T, it is a subset i.e., S ⊆ T, without any specific coordinates mapping each base in the read to a designated location in each of the transcripts in S. to obtain accurate pseudoalignments of reads to a transcriptome, fast hashing of k-mers is done together with the transcriptome de Bruijn graph (T-DBG).
The de Bruijn graph is very important for the assembly of DNA and RNA, where they are usually developed from reads. Kallisto also uses the T-DBG which is a de Bruijn graph developed from the k-mers present in the transcriptome and a path covering of graph. Path covering is a set of paths that covers all the edges of the graph after their union and correspond to the transcript. This path covering results of T-DBG results in induction of multi-sets on the vertices known as the k-compatibility classes. A compatibility class can be linked to a read which is error-free by representing it as a path in the graph. The k-compatibility class of a path is defined in the graph as the intersection of the k-compatibility of its constituent k-mers. An equivalent class for a read consists of multisets or several transcripts linked with the read; usually, it is characterized by the transcript from which the read originated and also provide significant statistic for quantification. An important feature of the k-compatibility class of an error-free read is associated with the minimal equivalence class having transcripts containing large k reads.
The overview of Kallisto is given by following figure 1:

Figure 1: Overview of Kallisto: The input contains reference transcriptomes and sequence reads obtained from the RNA-seq experiment. (a) Example read (black) and three overlapping exonic regions are represented. (b) Construction of index by creating the transcriptome de Bruijn Graph (T-DBG) where the k-mers are given by the nodes. Each transcript is linked to a colored path as shown and the path cover of the transcriptome results in induction of the k-compatibility class of a read. (c) the k-mers (V1, V2, V3, etc.) are hashed as represented by black nodes to determine the k-compatibility class of a read. (d) Skipping represented by b; ack dashed lines make use of the information present in T-DBG to skip the redundant k-mers because they have the same compatibility class (e) determination of k-compatibility class is done by taking the intersection of k-compatibility classes of its constituent k-mers.
The traditional technique takes a lot of time to determine the equivalence classes of reads but since the development of hash of k-mers, k-compatibility classes and the equivalence class of error-free reads are determined in less time.
Besides this, pseudoaligning utilizes an expectation-maximization (EM) algorithm to resolve multiple-mapped reads without associating them to a single taxonomic unit. EM algorithm optimizes the RNA-seq function as given by the following:

In this Function:
- F is the set of fragments (or reads)
- T is the set of transcripts,
- lt is the (effective) length of the transcript
- Yf,t is a compatibility matrix defined as 1 if fragment f is compatible with t and 0 otherwise.
- αt are the probabilities of selecting reads from transcript t. These αt are the parameters of interest since they represent the isoforms’ abundances or relative expressions.
Why Pseudoalignment is fast?
Pseudoalignment is a very fast and efficient technique. It finds out that where each read in the transcript is compatible, not where it will align. As already mentioned, the traditional techniques of alignment are quite time-consuming, for instance, if we want to align 20 samples with 30 million RNA-seq reads each then, the quantification with programs like Cufflinks will take almost 14h. on the other hand, when Kallisto was first developed in 2012, it took 5min 8 sec to build an index of the human transcriptome, and then quantification of 78.6 million GEUVADIA human RNA seq reads was done in only 14 min by using a standard desktop with a single CPU core. But this speed did not lack accuracy in any way.
The pseudoalignment tool maintains the key information which is required for quantification. To understand why pseudoalignment is fast, we will take into account that the traditional RNA-seq tools do an alignment in two parts i.e.,
- Alignment- Align reads to transcriptome or split reads over the reference genome.
- Quantification- converts the alignments to abundance metrics (FPKM, RPKM, TPM). For this purpose, two clusters of quantification tools are used i.e., count-based and Expectation-Maximization (EM) based. The main difference between the two is how they deal with ambiguous read alignments.
On the other hand, the Kallisto does pseudoalignment at a faster pace because it fuses these two steps i.e., the sequence reads obtained as a result of the RNA-seq experiment are pseudoaligned to reference transcriptome and its EM algorithm deconvolutes pseudoalignment to get transcript abundance.
Figure 2 represents the general workflow and the new workflow of RNA-seq data that is making the difference.
(a)

(b)

Figure 2: (a) General workflow of RNA-seq data analysis and the two conditions include control and treatment (b) Workflow with pseudoalignment using kallisto and kallisto alignment is shown with and without annotation.
Implications of speed
The pseudoalignment tools are not only fast but they are quite accurate. Although, it might appear surprising as the tools are not aligning but associating the reads due to compatibility in reality it is the compatibility information that is needed for the actual application. If seen from the point of view of compatibility, pseudoalignment and alignment are the same.
In most of the analyses, the primary consideration is the accuracy, Kallisto not only provides accuracy but with a paramount speed. The speed of Kallisto has three main implications:
- Bootstrapping: With Kallisto bootstrapping is efficient. The requirement for bootstrap is a rerun of the EM algorithms which are quite fast in Kallisto. This results in an accurate estimation of uncertainty in abundance values.

Figure 3: Bootstrapping in Kallisto. It is based on an analysis of 40 samples having 30 million reads which are resampled from 275 million RNA-seq reads. Each dot in the figure represents a transcript and it is colored as per its abundance. The x-axis represents the estimated variance from the Kallisto bootstrap on a single subsample while the y-axis represents computed variance from different subsamples of data. Here the empirical variance is recapitulated by bootstrap.
- Fast Index Building: Kallisto not only does fast quantification but the building of index is also very fast including the compilation of programs which is very easy and quick. This has made the RNA-seq data more informative and interactive because Kallisto allows dynamic exploration of data rather than waiting for a worthwhile analysis which can take weeks and months. For instance, easy quantification of data can be done against different transcriptomes and also re-quantification when the transcriptomes are updated. Also, the analysis of data is done locally without any need for cloud computation which makes this analysis output portable and secure.
- Fast turnaround of analysis improves the program itself. Kallisto can check the effects of algorithm changes. This allows efficient and quick debugging of the problems and better optimization. It also enables the developers to release updates that users will be able to test and use and it overcomes the need of the user to resort to complex computation that can take months.
Software of pseudoalignment is given in table 1:
Table 1: Pseudoalignment tools

Conclusion:
As a whole, it is safe to say that the pseudoalignment has allowed an efficient and accurate way to analyze transcriptomic data. It liberates the user from the bioinformatics core facility, usage of cloud, employment of multi-core server, and most-importantly time to analyze tons of data. But besides these advantages, still, a lot of work needs to be done as some of the studies have found that accurate quantification of lowly-expressed or small RNA is very difficult to achieve with pseudoalignment tools. Thus, a lot of work is needed to be done.