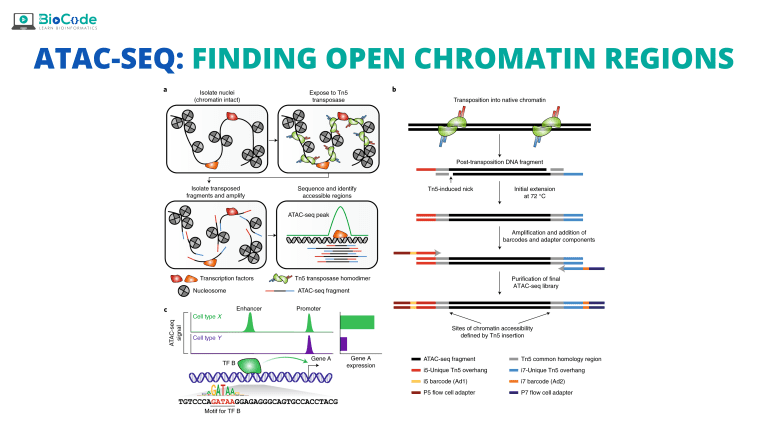
ATAC-Seq is unusually unforgiving. The assay depends on a transposase inserting into accessible chromatin, and small departures from the protocol — slightly too much enzyme, slightly degraded nuclei, a little too much mitochondrial carryover — produce libraries that sequence fine and mean nothing.
The good news is that failure is visible before you analyse anything, in three metrics. This article covers what they measure, what good looks like, and how to read the diagnostic plots.
TSS enrichment: the single most informative number
Transcription start sites are, in almost every cell type, the most reliably accessible regions of the genome. So signal should concentrate sharply there. TSS enrichment measures how strongly, comparing read density around annotated TSSs against background.
Plot coverage in a window of a few kilobases either side of every TSS and average. A good library shows a tall, narrow peak centred on the TSS. A failed one shows a shallow bump or none at all.
As rough guidance for human data, ENCODE treats a score above 7 as acceptable and above 10 as good; below about 5 the library is generally not usable for anything careful. Note the score depends on the annotation and the exact calculation, so compare within a project rather than across papers.
A low TSS enrichment score with normal-looking sequencing statistics almost always means the biology failed, not the sequencing — typically dead or damaged cells, over-digestion, or nuclei that lysed before tagmentation.
Fragment size distribution: reading the nucleosomes
This is the most diagnostic plot in the whole assay, and it takes seconds to produce.
Tn5 inserts into DNA that is not wrapped around a nucleosome. In a healthy library, the resulting fragment lengths show clear structure:
- A large population below ~100 bp — nucleosome-free regions, where the interesting regulatory signal lives.
- A distinct peak around 180–250 bp — fragments spanning one nucleosome.
- Smaller peaks near ~400 bp and sometimes ~600 bp — two and three nucleosomes.
That decaying periodicity is the signature of intact chromatin. Its absence is the clearest evidence of a failed experiment:
- Everything short, no nucleosomal peaks: over-tagmentation. Too much Tn5 or too long an incubation has cut through nucleosomal DNA, destroying the accessibility signal.
- Everything long, weak sub-100 bp population: under-tagmentation, or too many cells for the enzyme.
- A smooth distribution with no structure: degraded chromatin, often from poor nuclei preparation or freeze-thaw damage.
FRiP: how much of the data is signal
Fraction of Reads in Peaks is exactly what it sounds like — the proportion of reads falling inside called peaks. It measures signal-to-noise directly.
Above roughly 0.3 is good for bulk ATAC-Seq; below 0.2 suggests high background. Interpret it alongside peak count: a high FRiP with very few peaks can mean signal concentrated in a handful of highly accessible regions, which is its own problem.
FRiP also depends on peak calling parameters, so it is a within-project comparison metric rather than an absolute standard.
The two filtering steps people forget
Mitochondrial reads
Mitochondrial DNA is not chromatinised, so Tn5 attacks it freely. In unoptimised protocols mitochondrial reads can be the majority of the library — occasionally over half. They carry no information about nuclear accessibility and simply consume sequencing depth.
Remove them before anything else, and record the fraction: a rising mitochondrial percentage across samples usually signals a deteriorating nuclei preparation. Omni-ATAC and similar protocol refinements exist largely to reduce it.
Blacklist regions
Certain genomic regions — repeats, some satellite and centromeric sequence — accumulate spuriously high signal in every experiment regardless of biology. The ENCODE blacklist enumerates them.
Failing to remove them produces peaks that appear in every sample, sometimes with striking apparent significance, and they are pure artefact. This is one of the most common causes of confusing ATAC-Seq results.
Duplicates and library complexity
PCR duplicates must be removed, but the duplication rate is itself informative: a high rate means the library had few distinct fragments and sequencing deeper will not help. Complexity metrics such as NRF and PBC quantify this. A low-complexity library cannot be rescued computationally — it needs more input material or fewer PCR cycles.
Reading a failed run
Putting it together, the combination of metrics identifies the failure mode:
- Low TSS enrichment + no nucleosomal periodicity: over-tagmentation. Reduce enzyme or incubation time.
- Low TSS enrichment + normal periodicity: likely poor cell viability or wrong cell input; the chromatin was intact but the accessibility landscape was disturbed.
- Good TSS enrichment + low FRiP: real signal diluted by background; often recoverable with deeper sequencing or stricter filtering.
- High mitochondrial fraction + everything else acceptable: wasteful but salvageable; the usable depth is simply lower than the read count suggests.
- High duplication + low complexity: insufficient starting material. Repeat the experiment.
Report the metrics, including the bad ones
These numbers should appear in the methods section of any ATAC-Seq paper and in any analysis report. Reviewers increasingly ask for them, and their absence is reasonably read as a sign they were never checked.
A sample that fails these checks should be excluded and said to have been excluded. Quietly including a marginal library and hoping downstream statistics absorb the noise is how irreproducible chromatin results enter the literature.
Keep reading
Take it further
Learn this properly, with the work in front of you
Reading about it gets you the idea. Hands-on ATAC-Seq Data Analysis for Identification of Chromatin Accessibility Using Linux & R walks through the whole thing in order with videos you can follow at your own pace and a certificate at the end.
No free trial. Cancel whenever you want. Every course issues a verifiable certificate.


Join the discussionLeave a comment ↗