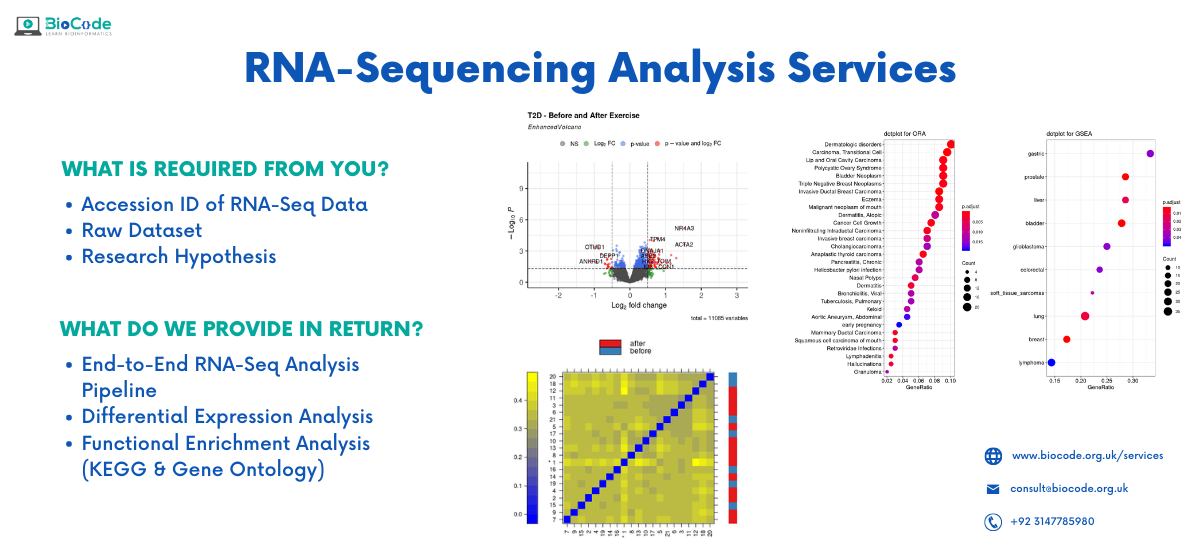
We provide complete services for RNA-Seq Analysis
From data collection, preprocessing, quality control to transcription factor binding sites, histone modifications and much more.
Providing services to
worldwide clients
Datasets
analyzed
Qualified researchers and
Bioinformatics analysts
Satisfied orders processed
Our Services
- Trimming and Mapping of reads on the reference genome/transcriptome
- Provide Aligned data(BAM/SAM file) for quantification of reads
- De-multiplexed, aggregated Picard BAM file with summary metrics
- De-novo transcriptome assembly
- Detection of transcripts and isoforms
- Detection of RNA SNP/INDEL
- Conducting differential expression analysis of genes, isoforms and exons
- Provide DGE results (CSV file)
- Perform Differential splicing analysis (DEXSeq report)
- Discovery of Gene fusion
- Discovery of Novel transcript
- Performing analysis of fusion genes, circularized RNAs and trans-splicing events
- Identification of differentially expressed non-coding RNAs
- Identification of differentially expressed miRNAs
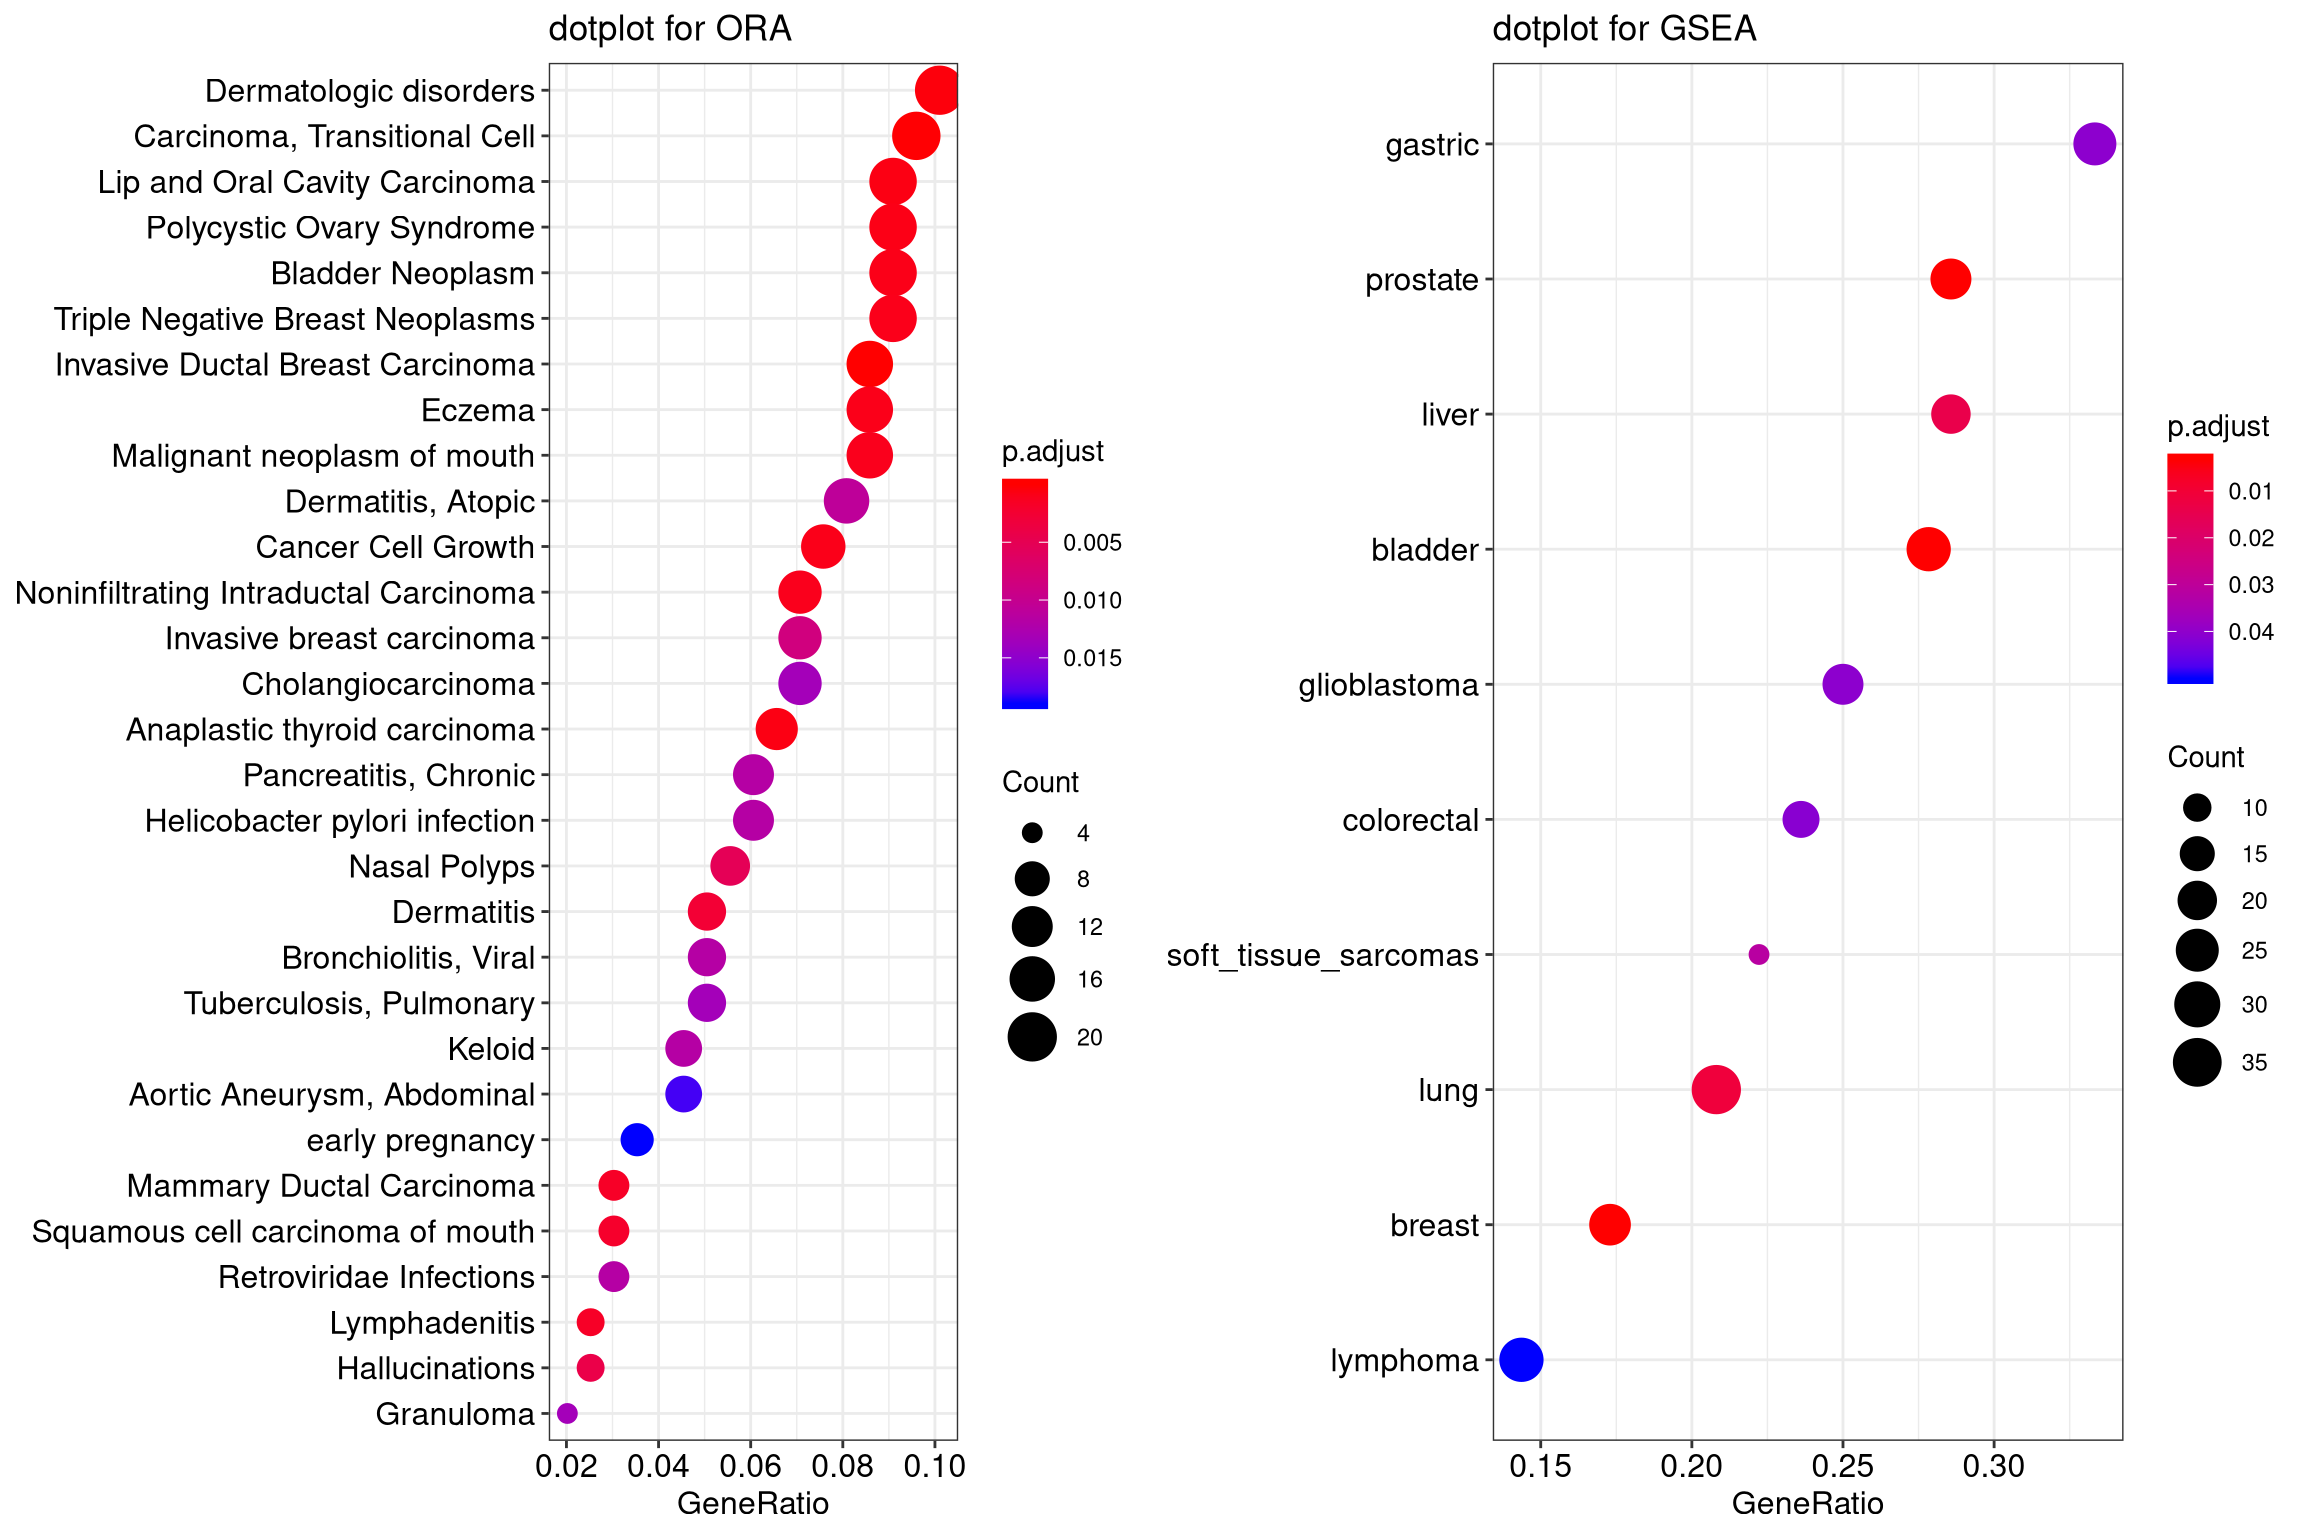
- Perform functional enrichment analysis


RNA-Seq is an exciting and in-demand next-generation sequencing (NGS) method used for identifying genes and pathways underlying certain diseases or conditions. Over the past decade, RNA-seq has become an indispensable tool for transcriptome-wide analysis of differential gene expression and differential splicing of mRNAs. RNA-seq offers many advantages over microarray technology.
RNA sequencing data analysis emphasizes the complicated mechanisms of gene regulation. It analyzes the transcriptome, indicating which of the genes encoded in our DNA are turned on or off and to what extent. RNA-seq data allows for a wide range of analyses to address countless research questions across the fields of biology and biomedicine.
Below are the steps necessary to perform RNA-sequencing data analysis:
Data Retrieval
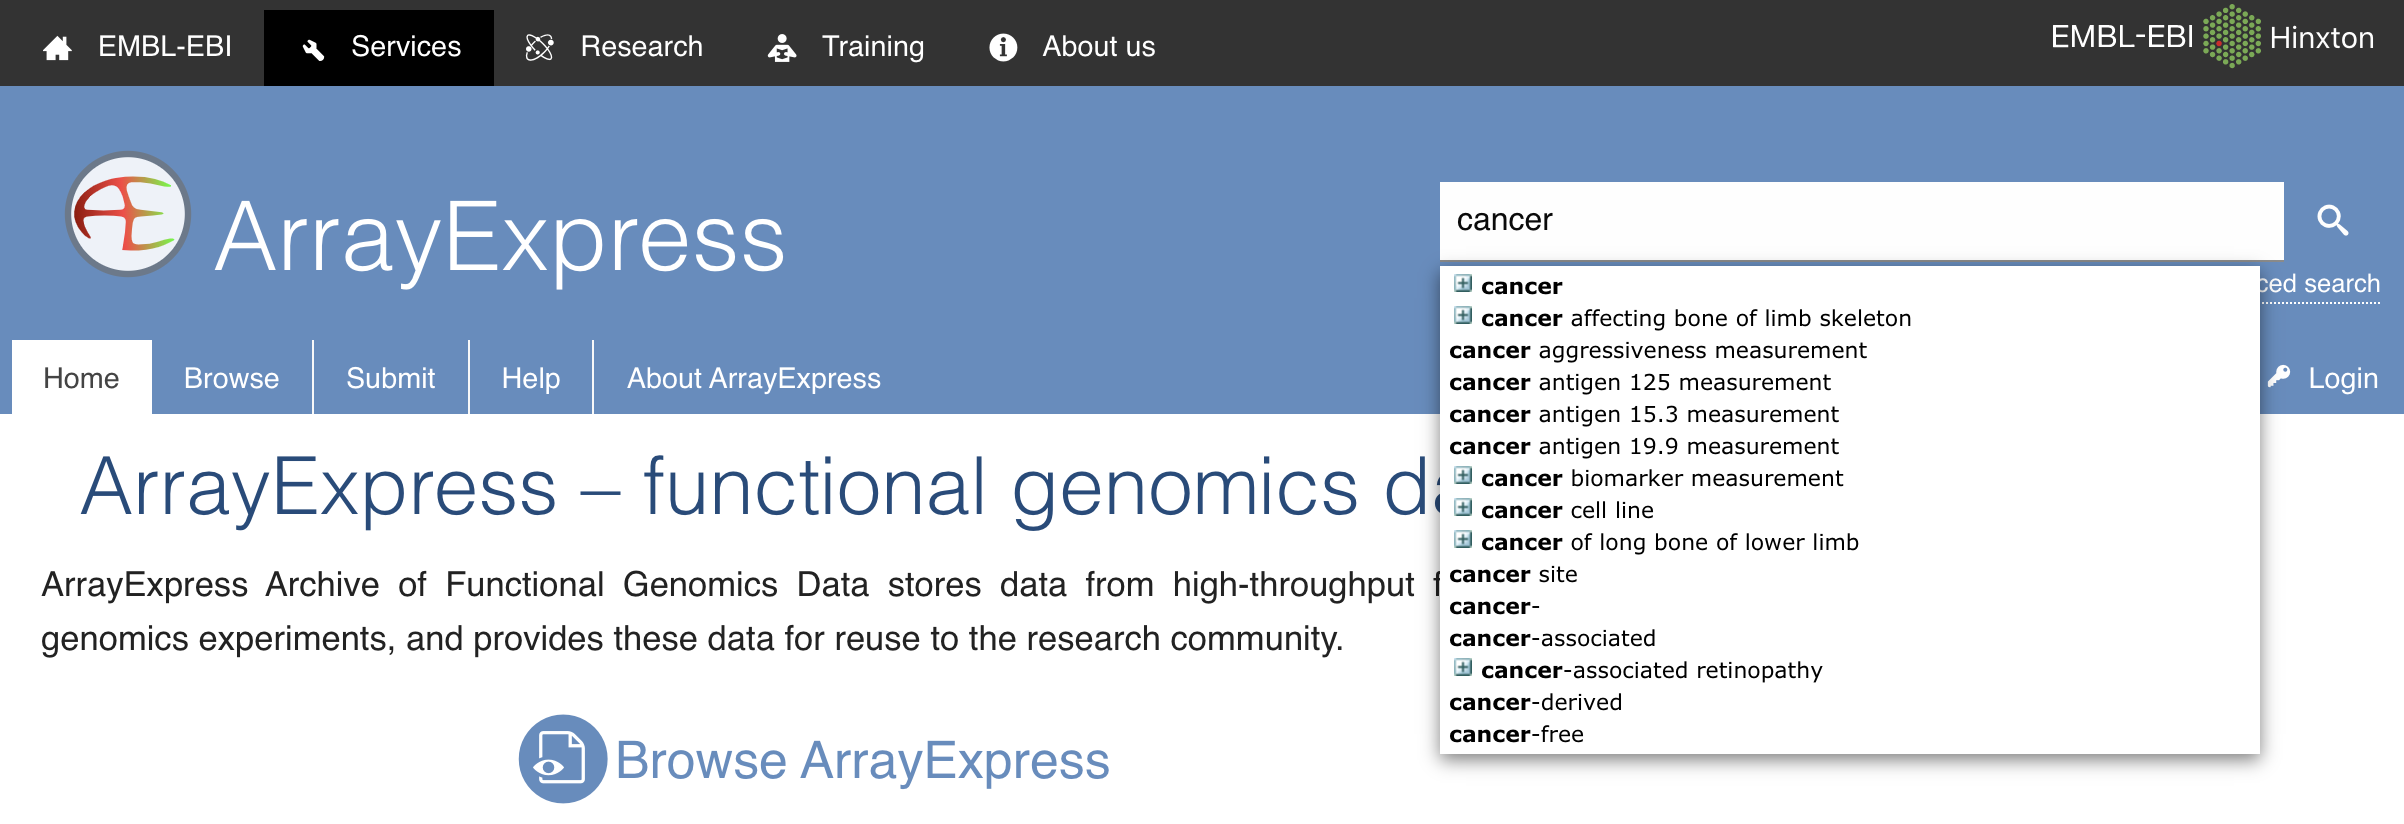
RNA-Sequencing data analysis pipeline starts with data retrieval which is done by finding the required dataset that is in the bam or fastq file format. This raw dataset can be found on Array Express, GEO-NCBI, EMBL-ENA etc. After retrieving the dataset we will perform the next step in the pipeline which is quality control.
We can also perform the data analysis on in-house sequenced data.
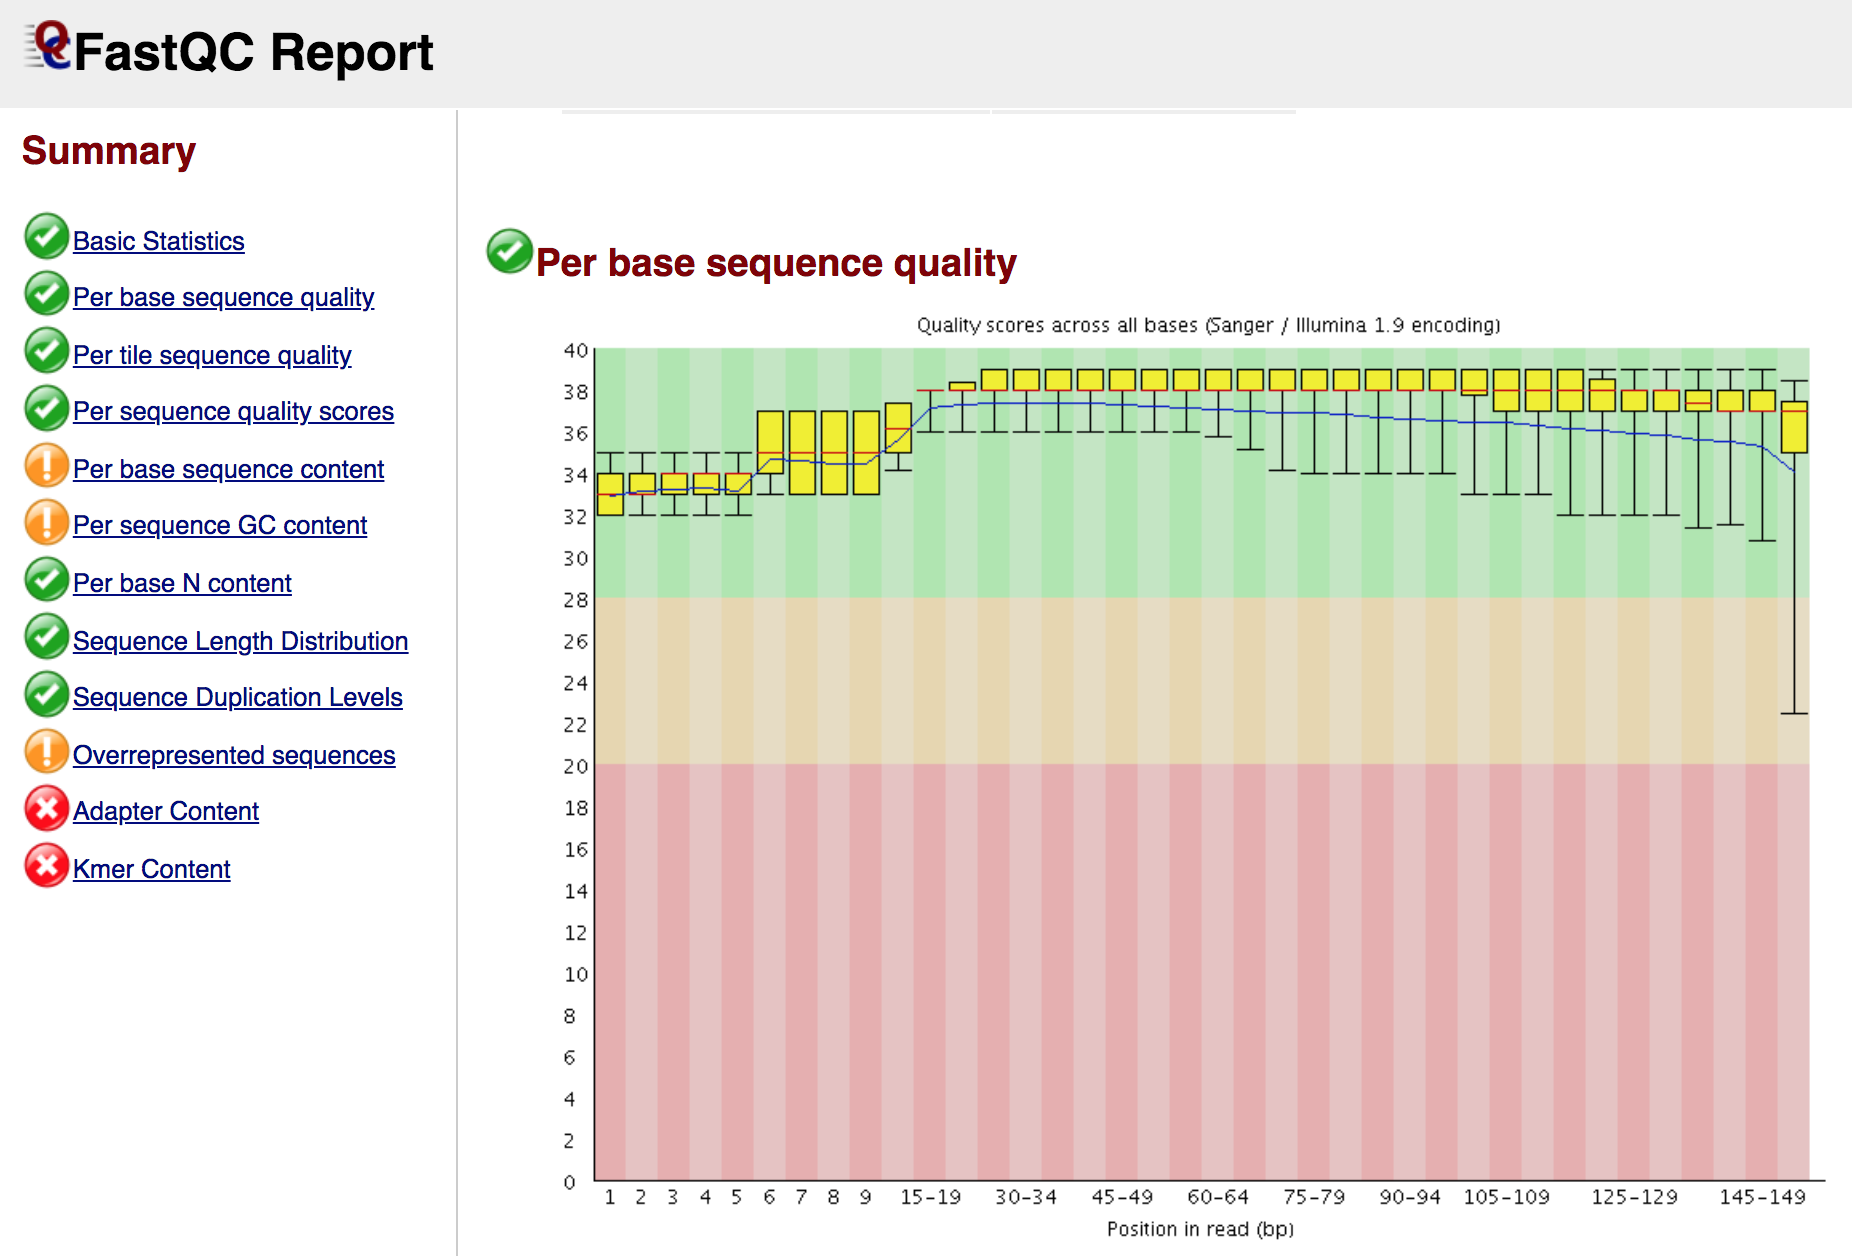
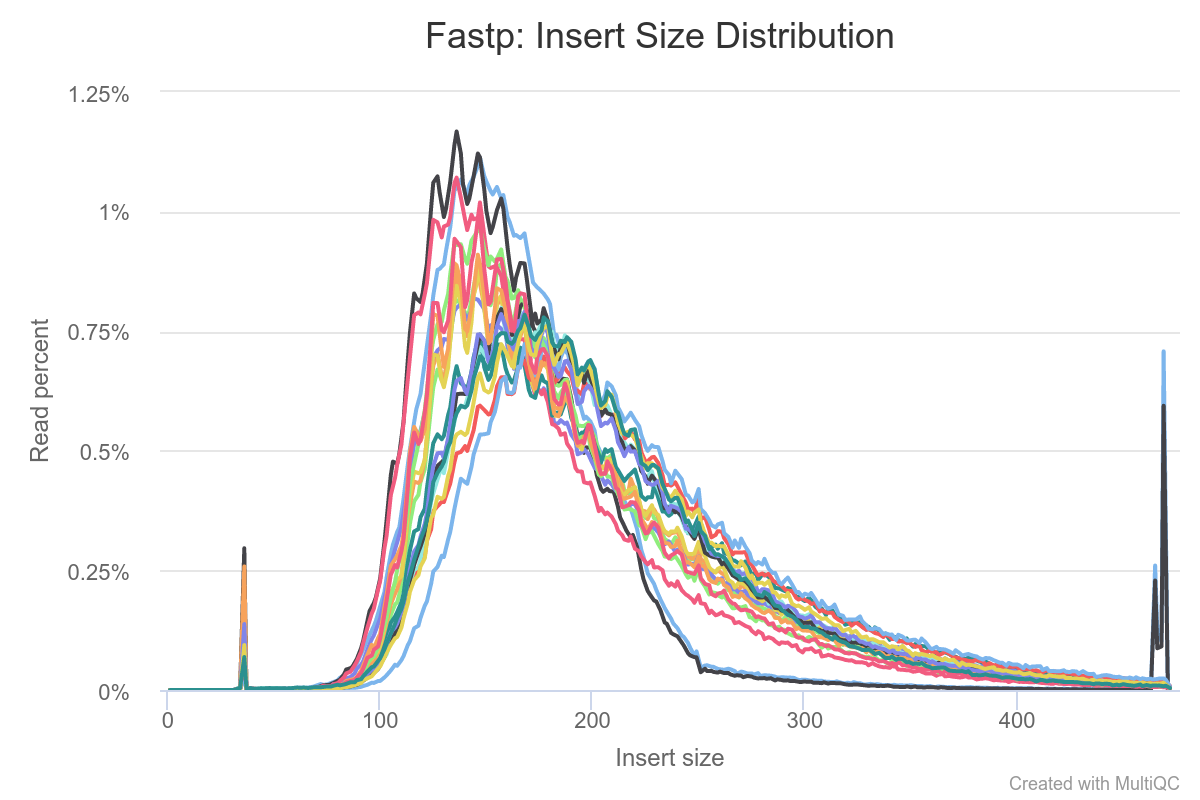
Quality Control
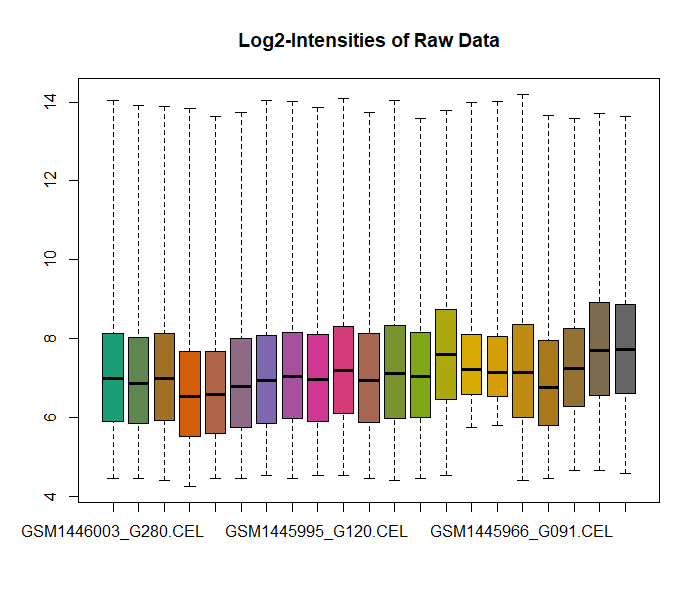
Quality control and preprocessing of data are important for data analysis because raw data produced after sequencing must be processed so that the results should not have false positive and false negative results. It can be done with various tools for instance FASTQC, Trim Glore. Pre-processing of data not only evaluates each analysis step but also it reduces the amount of low-quality sequence reads or adaptor contaminated sequence reads.
Tools that we use for Quality Control
- FastQC
- Fastp
- Cutadapt
- Trimmomatic
- Trim Glore
Read Mapping/Alignment
Read mapping is important because these sequence reads have no value until they are mapped or aligned against a reference genome or assembled into a genome using de novo assembly. Therefore first we have to figure out where the sequences originated from in the genome in order to determine which genes they belong to. In order to perform alignment we can use any alignment tool e.g HISTA2, STAR, BowTie2 etc.
Tools that we use for Read Mapping/ Alignment
- HISAT2
- STAR
- BowTie
- GSNAP
- Salmon
- Kallisto
- Sailfish
Assembly and Read Quantification
In assembly for the purpose of quantification we assemble the reads into a transcriptome. This quantification will help us in creating raw gene countables. In order to assemble RNA-seq sequence alignments into transcripts we can use any assembler for example StringTie.
Tools that we use for Assembly and Read Quantification
- StringTie
- HT-Seq
- FeatureCounts
- CuffLinks
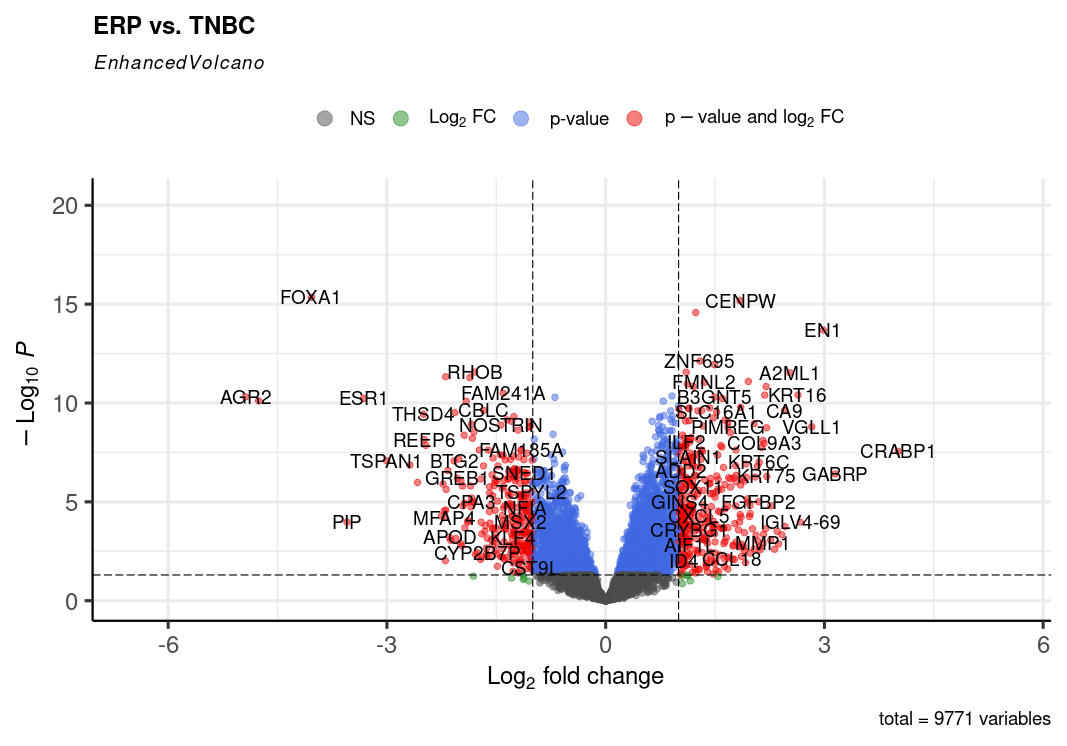
Differential Gene Expression Analysis
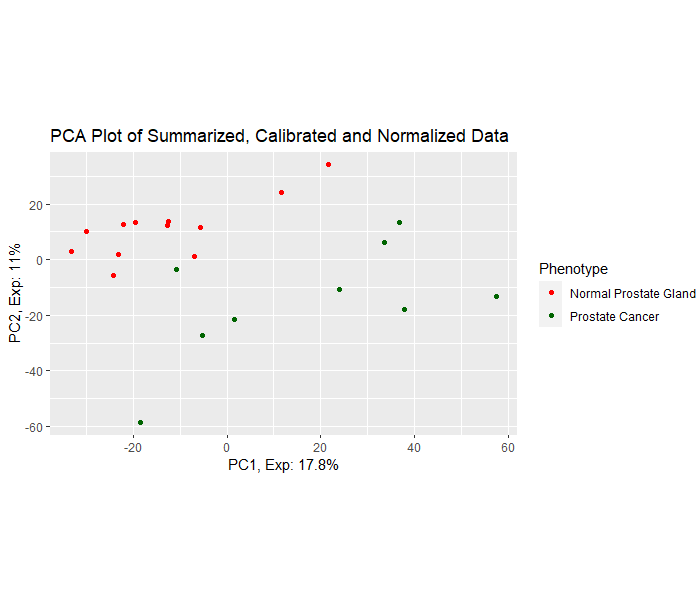
Differential expression analysis means taking the normalized read count data and performing statistical analysis to discover quantitative changes in expression levels between experimental groups. The raw gene countables created in the transcriptome assembly step will be used in differential gene expression analysis using any differential gene expression tool for instance Ballgown under two or more conditions. After obtaining the differentially expressed genes, we will finally perform the downstream analysis.
Tools that we use for Differential Gene Expression Analysis
- DESeq2
- edgeR
- Sleuth
- Ballgown
Functional Enrichment Analysis
In downstream analysis first comes the Functional Enrichment Analysis. It is a method to determine classes of genes or proteins that are over-represented in a large group of genes or proteins and may have relations with disease phenotypes. Functional enrichment analysis is done using various tools for instance KEGG pathways, topGO or enrichR.
Tools that we use for Functional Enrichment Analysis
- topGo
- enrichR
- ClusterProfiler
- GSEA
Protein-Protein Interaction
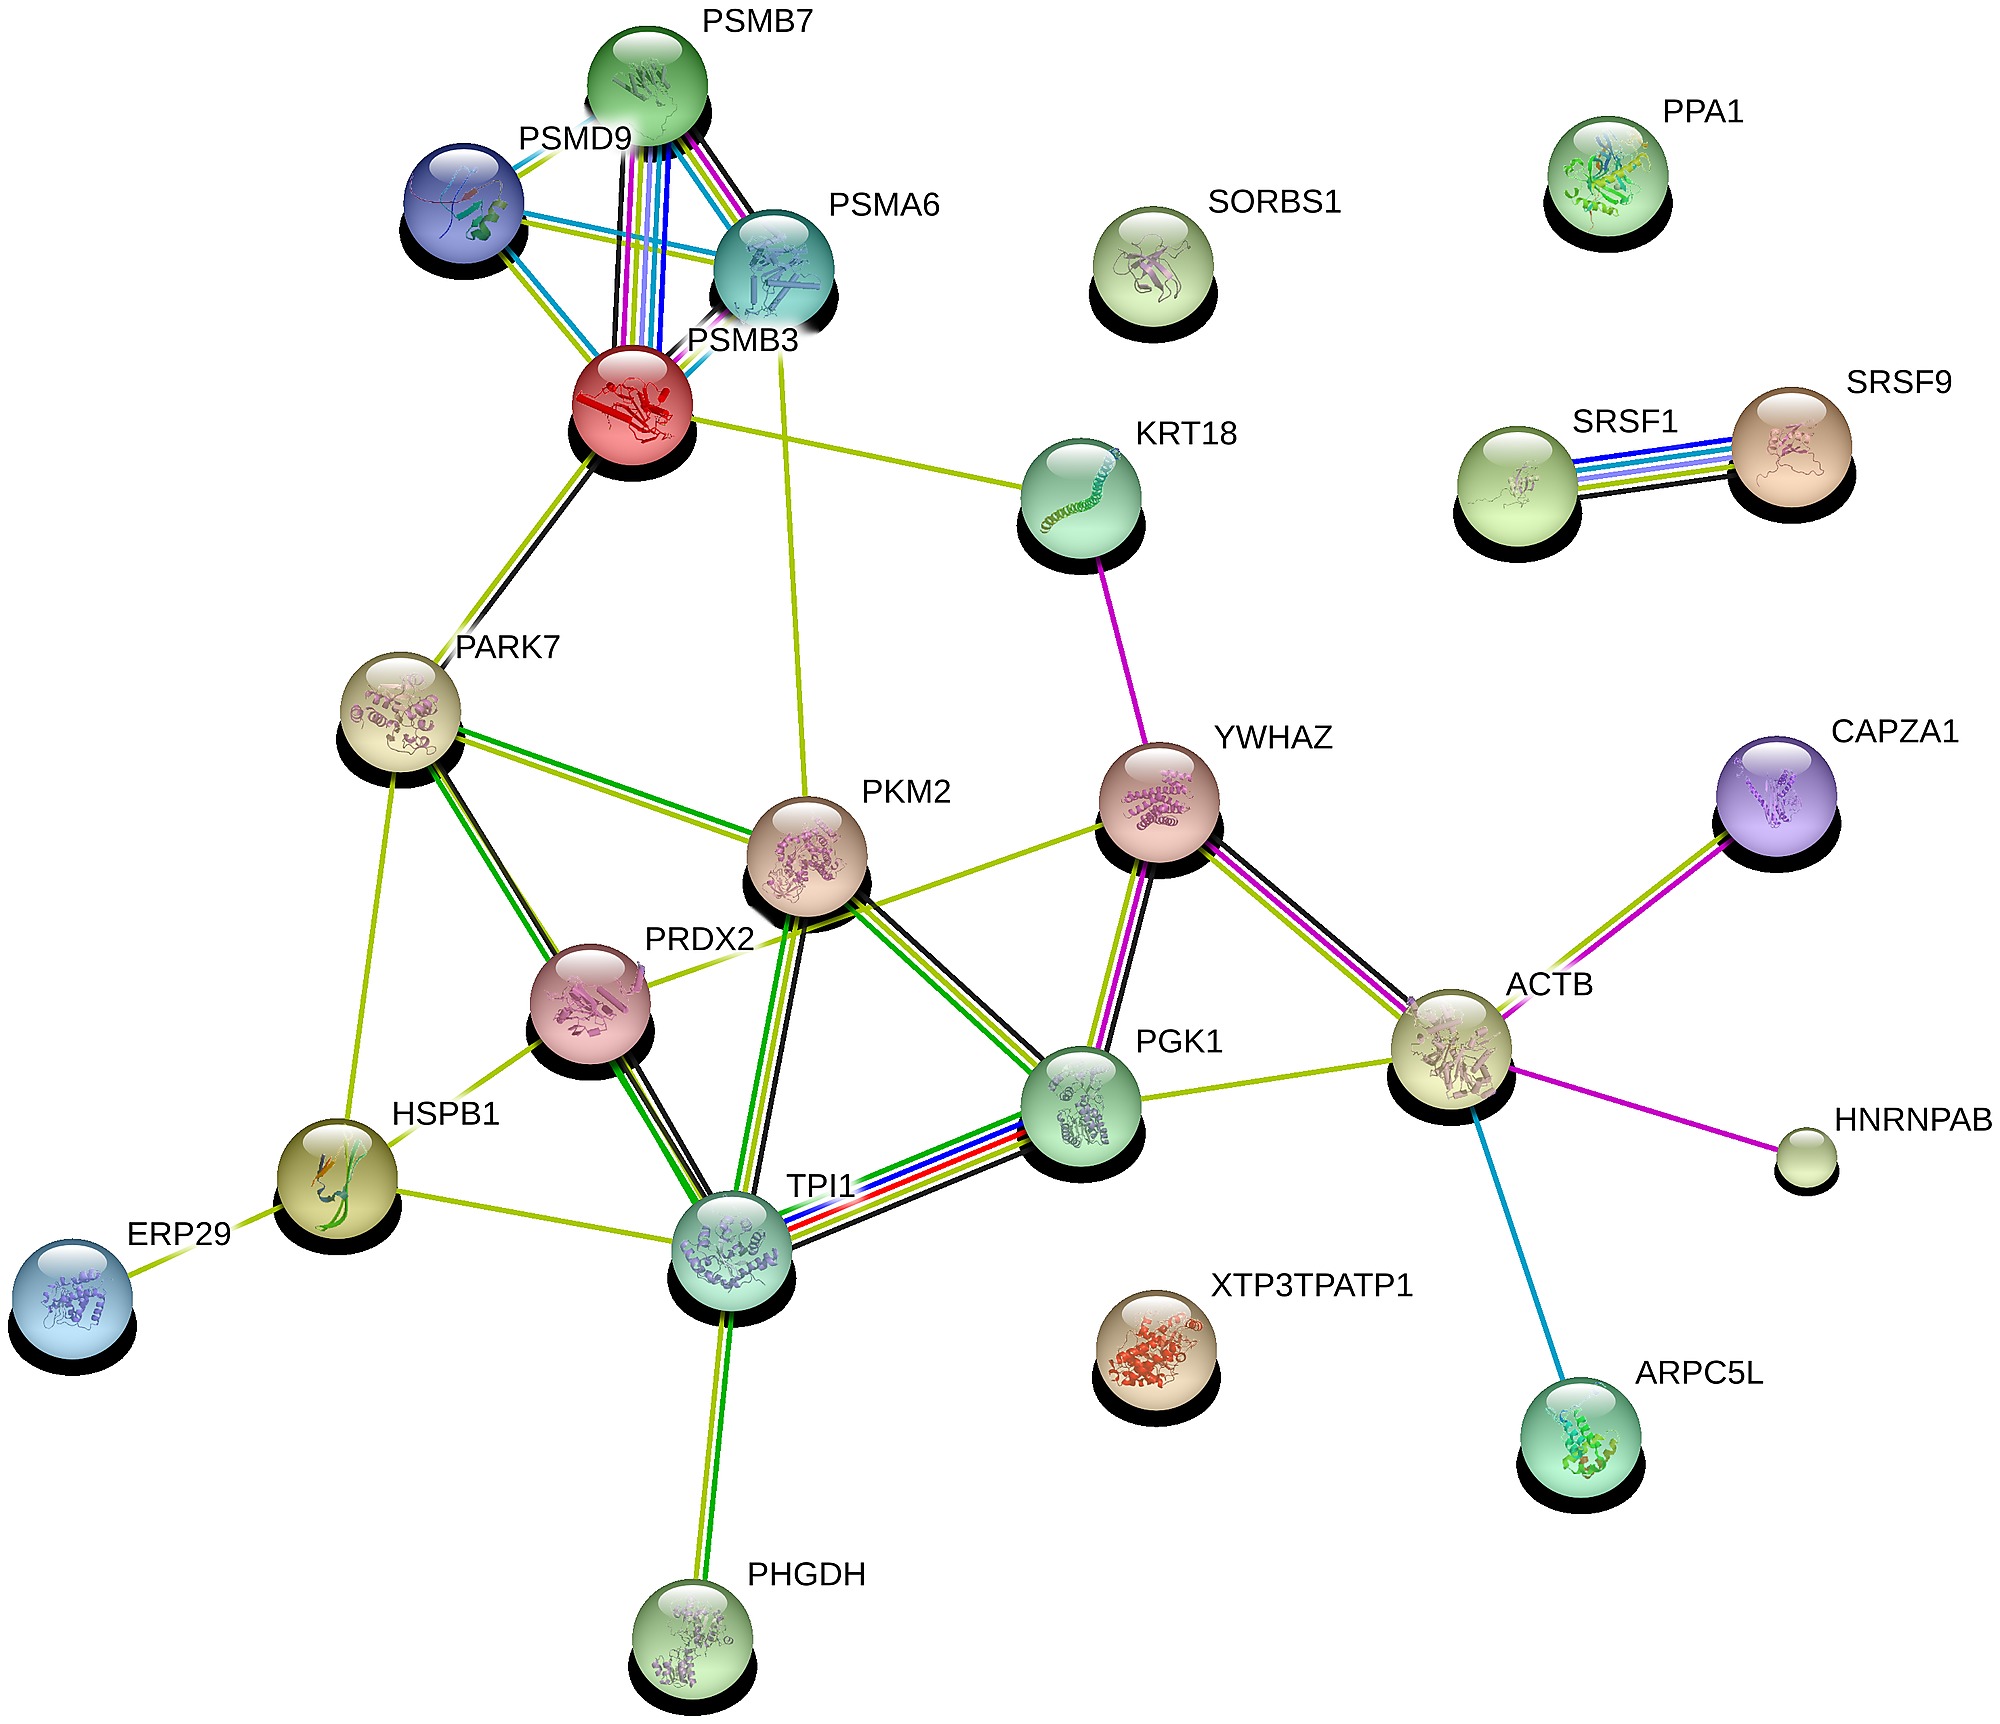
To perform the protein-protein interaction (PPI) network, we use any of the databases available for PPI interaction for example STRING. We go to the STRING database to input our differentially expressed genes list in order to perform protein-protein interaction.
Network Analysis
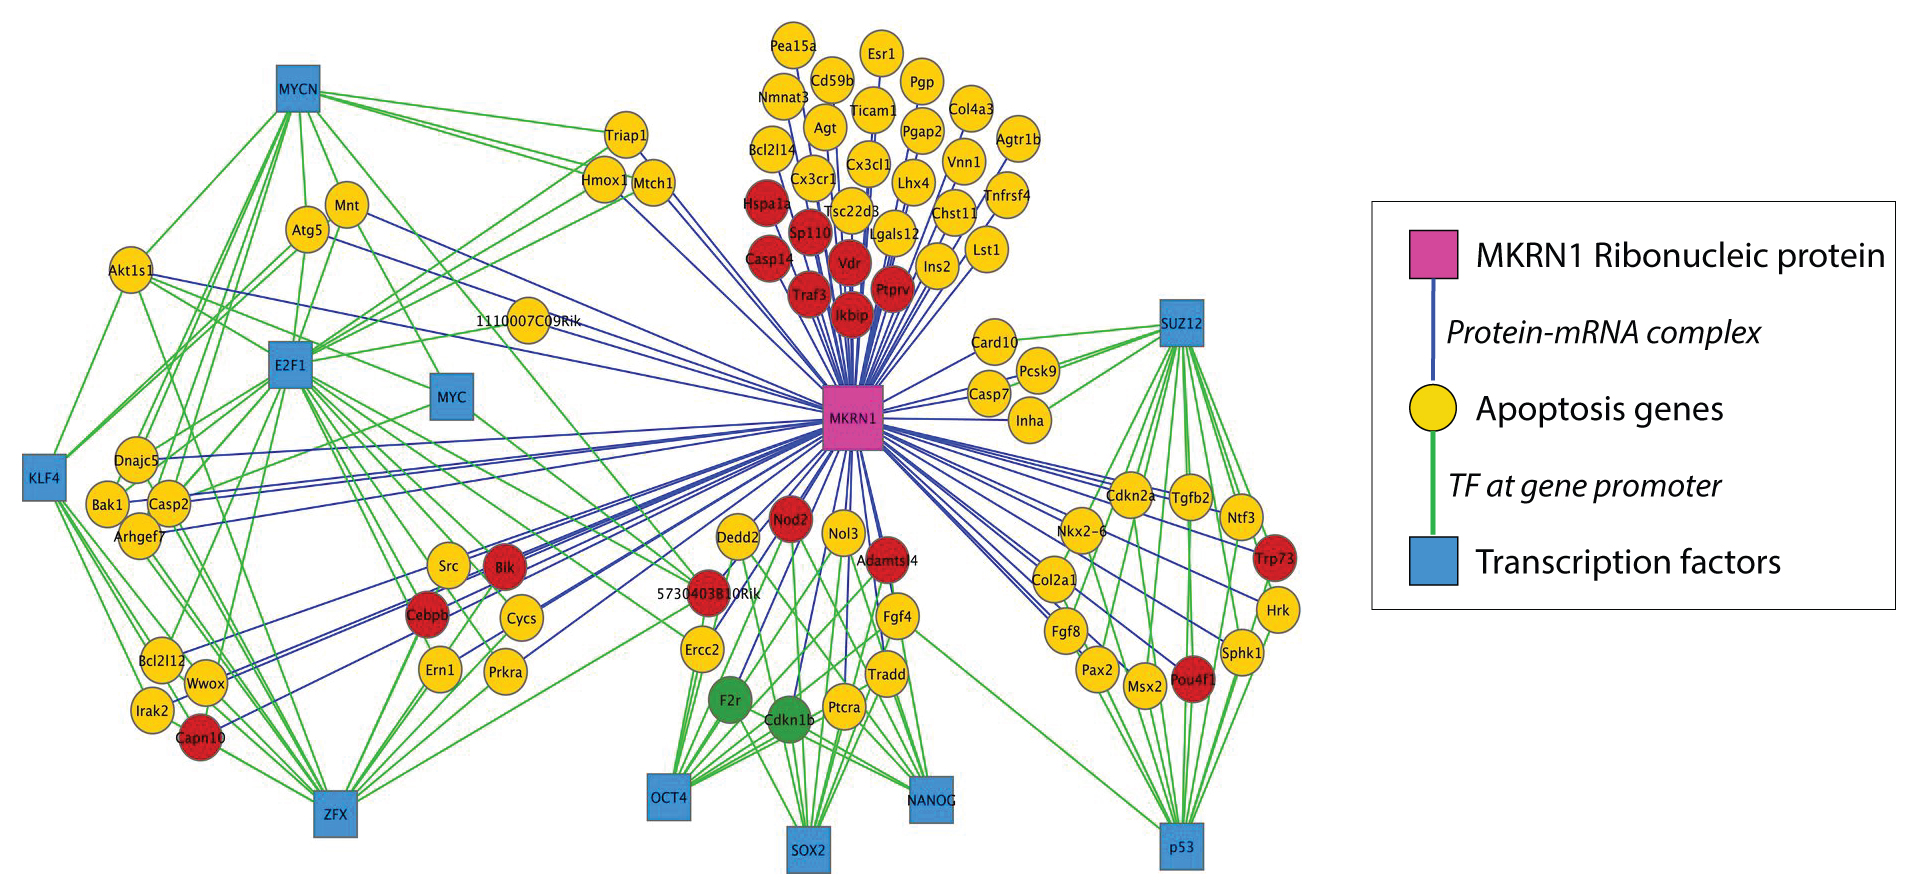
In network analysis we take the data of differentially expressed genes samples that are found between two states(e.g. normal vs. disease) and find correlations of DEGs based on their expression values to detect regulatory relationships among them. Significant correlations suggest connections between DEGs and are used to generate a network of DEGs. Then network interrogation is performed to detect modules, key regulators, and functional pathways that are important for state transitions. Based on the findings from network interrogation, new hypotheses are generated and can be tested in newly designed experiments. Cytoscape is an open source software platform for integrating, visualizing, and analyzing measurement data in the context of networks. This protocol describes a network analysis workflow in Cytoscape for differentially expressed genes from an RNA-Seq experiment.
The entire analysis is performed on Linux and R using in-house scripts. We use the Linux operating system to perform genomics analysis. We also write Python scripts in order to automate the RNA-Seq pipeline. We efficiently write code in R language by utilizing different bioinformatics packages for the analysis.
Get in touch with us and we will start your analysis right away!
