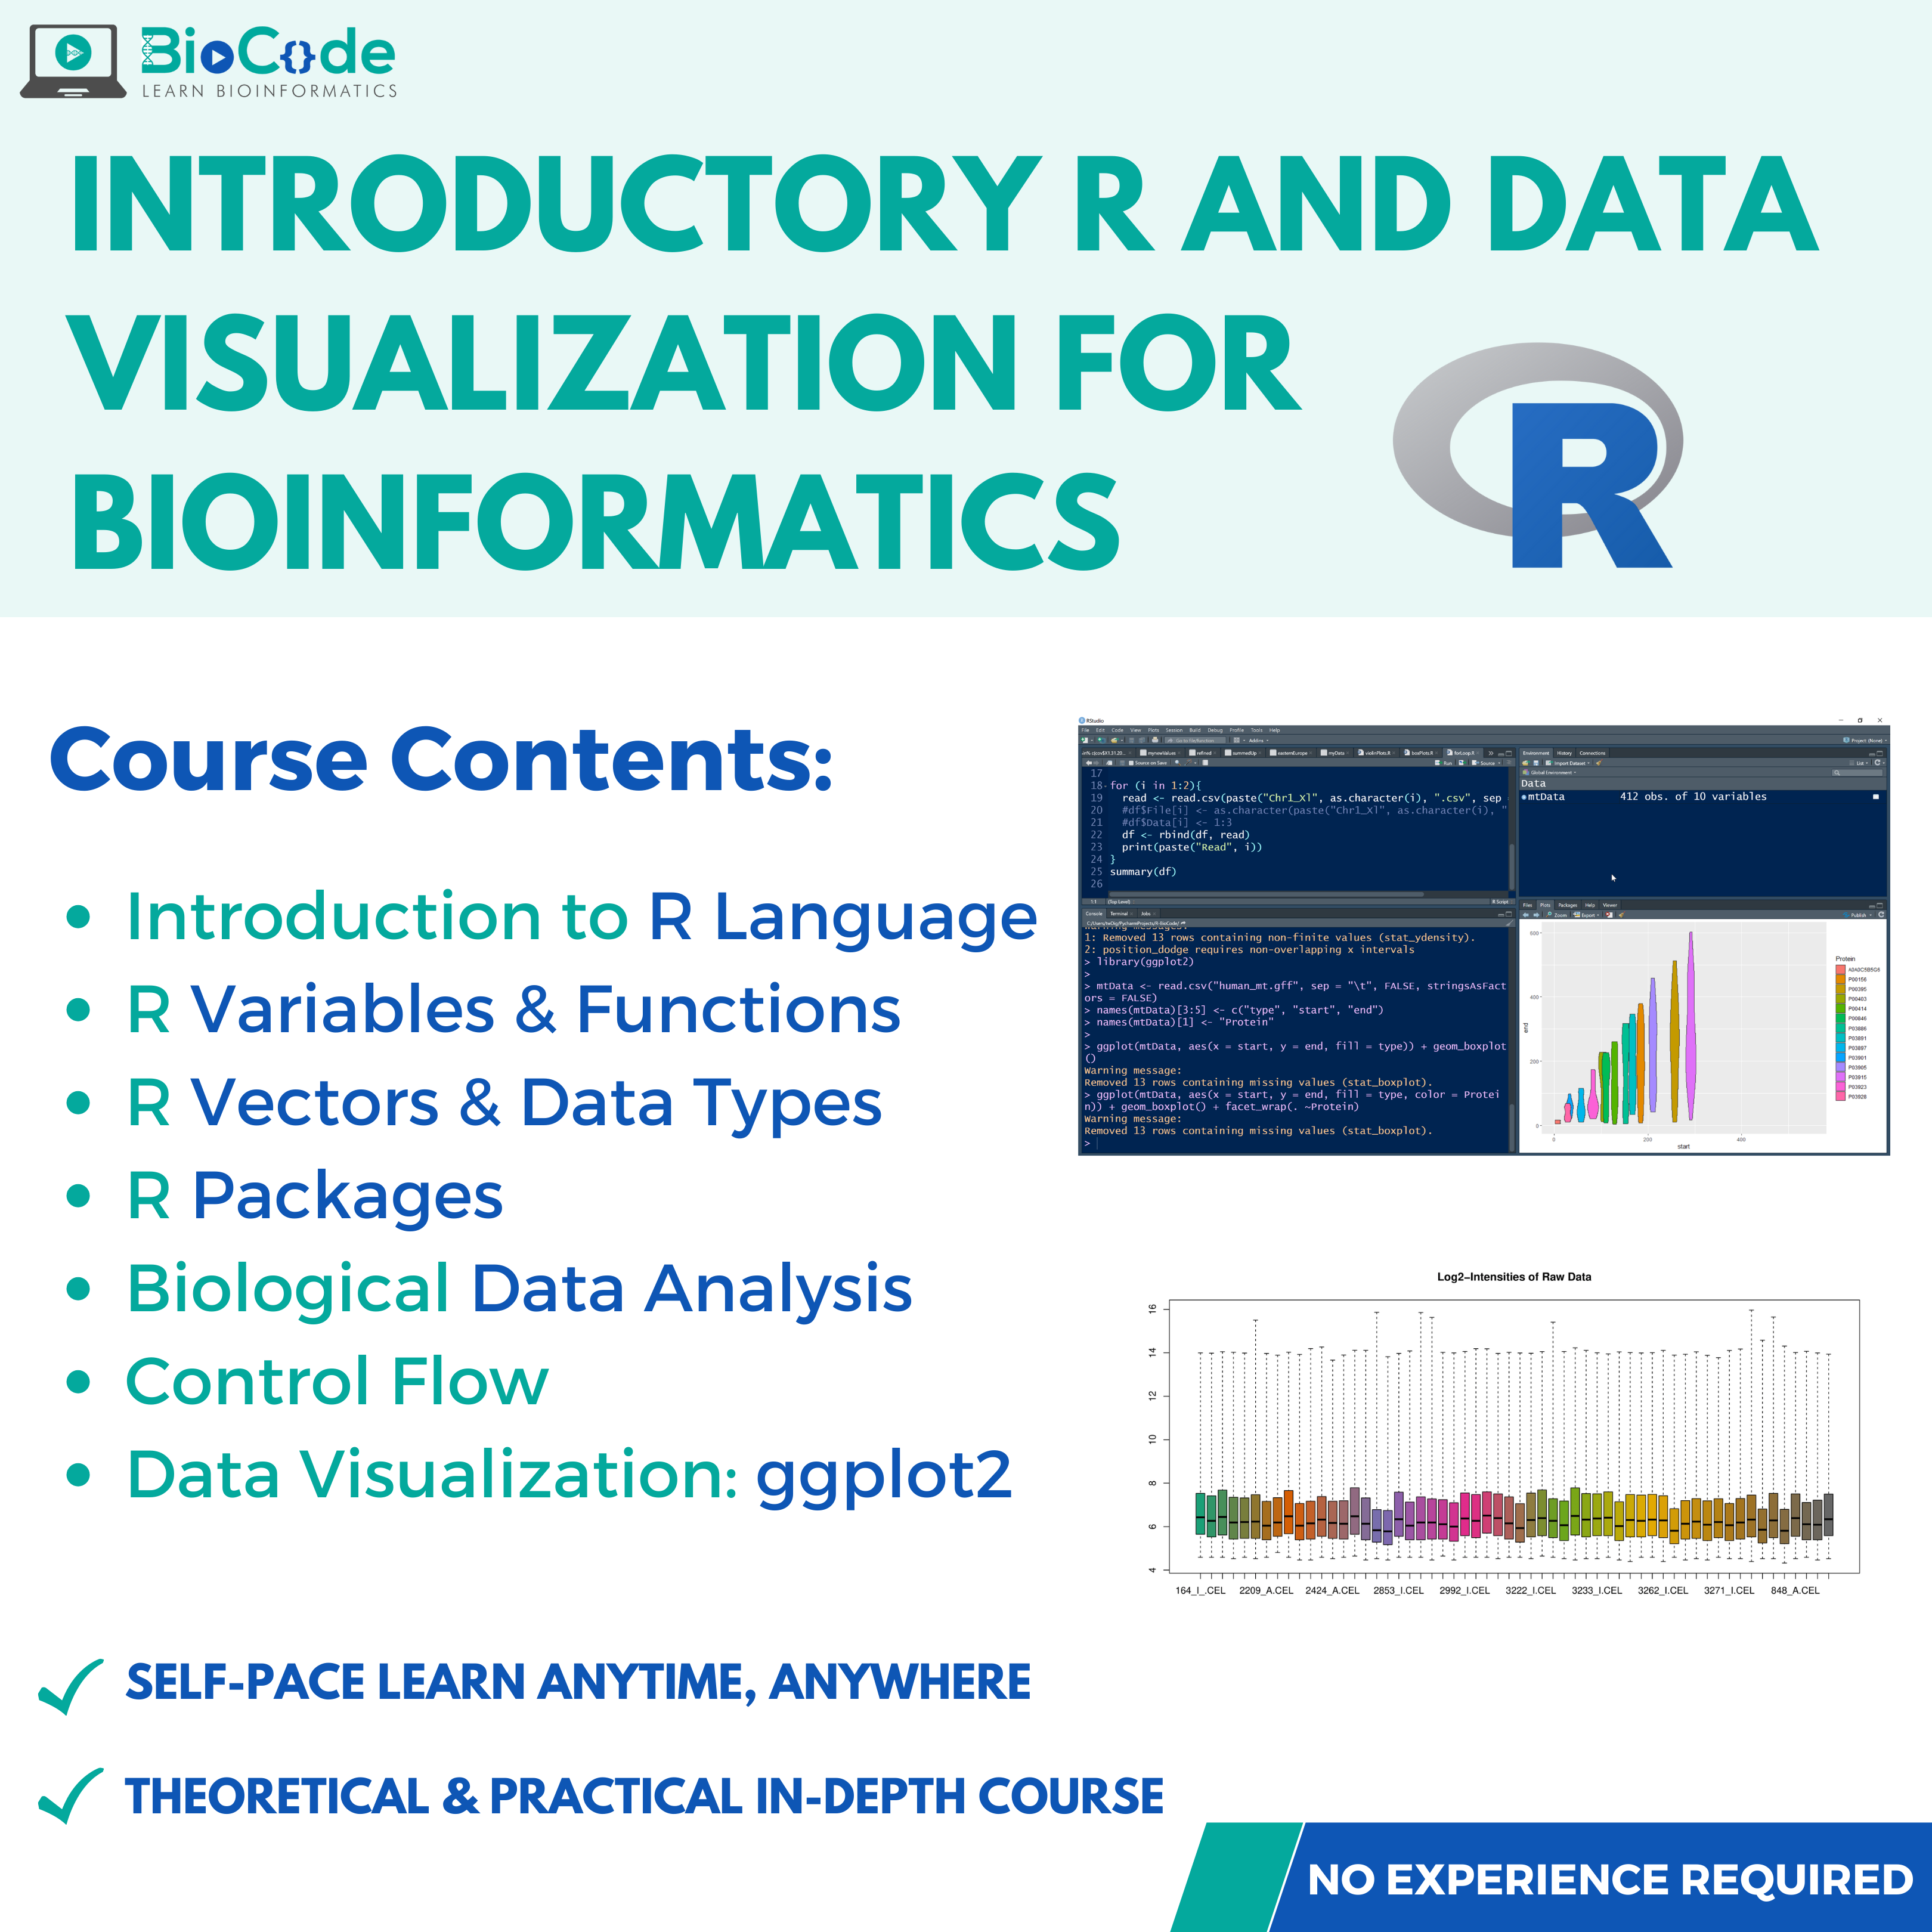
Introductory R and Data Visualization for Bioinformatics
About Course
Biological data visualization is an important aspect of bioinformatics which involves the graphical representation of unstructured or structured data to display information hidden in the plots/graphs. Biological data visualization is essential for your research because it validates the hypothesis based on visual inspection of the data analysis. It allows you to compare the gene expression intensities among a large set of samples. The ggplot2 package of R provides various functions to create different graphs and allows modification, annotation, and much more.
BioCode is offering an Introductory R & Data Visualization for Bioinformatics course in which you’ll learn how to write scripts in R language so that you can perform biological data visualizations. You’ll be able to write customized scripts to generate publication-ready and high-quality graphical plots of biological datasets to visualize, analyze and compare the datasets in a more insightful way, such as volcano plots, heatmap, dot plots, frequency plots, scatter plots, histograms, and bar charts with customized labeling. In this course, you’ll be able to create publishable figures for research papers, proposals, and review papers.
If you’re a beginner in bioinformatics, an experimental biologist, a bioinformatics researcher, or someone with no knowledge of scripting or bioinformatics, our course will help you greatly. You’ll be practicing on a case study of human mitochondrial proteome and genome along with a real-world gene expression dataset. Therefore, you will not only learn how to code in R language but you’ll also be able to perform data visualization with ggplot2 in R on real-world biological data.
This course will include the following section:
Section 1: R Language & Data Visualization
Description: This section will focus on making sure that the students learn how to write code in R language and how biological data is visualized using the ggplot2 package in R language.
Learning Outcomes: Upon completion of this section, students will be able to:
- Discuss R Language.
- Install R Language.
- Explain Comments.
- Explain Samples and Replacement.
- Declare Variables and Objects.
- Use Built-in Functions and ARGS.
- Write their own Functions and Arguments.
- Create Customized Scripts.
- Explain Attributes and Names.
- Explain Characters, Integers, Doubles, Logicals, and Factors in R.
- Explain Atomic Vectors in R.
- Discuss Dim and Dimensions in R.
- Describe Coercion.
- Describe Matrix and Matrices.
- Explain Arrays and Lists.
- Describe Class in R.
- Discuss Packages in R.
- Install Bioinformatics Packages in R.
- Initialize Library to Perform R Functions.
- Load Biological Data.
- Describe Zero Notation for Subsetting Biological Datasets.
- Save Biological Data.
- Perform R Notation and Select Values from Biological Datasets.
- Explain Data Frames.
- Discuss Positive Integers for Subsetting Biological Datasets.
- Discuss Negative Integers for Subsetting Biological Datasets.
- Explain Dollar Signs for Subsetting Biological Datasets.
- Explain Blank Spaces for Subsetting Biological Datasets.
- Modify Values in Existing Datasets.
- Explain NA (Not Available) Values in Biological Datasets.
- Figure out NA Values in Biological Datasets.
- Perform Logical Subsetting in Biological Datasets.
- Use If Else Statement in Code.
- Use For Loops and Perform Biological Data Binding.
- Use While Loops and Read Multiple Biological Datasets.
- Describe Key Components in ggplot2.
- Visualize Human Mitochondrial Proteome.
- Facet the Human Chromosome Dataset.
- Smooth Out the Biological Data.
- Create Box Plot for Human Mitochondrial Proteome.
- Create Histograms for Human Mitochondrial Pattern Finding.
- Create Frequency Plots for Human Mitochondrial Information Frequency Mining.
- Create Bar Charts for Human Mitochondrial Knowledge Mining.
- Scale and Limit Data Visualization.
- Change Labels and Finalize Visualizations.
- Visualize a Phylogenetic Tree.
- Save Visualizations in High Resolution.
Not ready to enrol?
Get the free syllabus & course updates
We'll email you the full outline for this course plus a starter guide — no spam, unsubscribe anytime.
Tools & technologies you'll use
- R
Course Content
R
-
Introduction to R in Bioinformatics & R Installation
09:48 -
The R Studio Interface Explanation
06:23 -
Comments
04:17 -
Sample & Replacement
09:09 -
Variable Declaration and Objects
05:24 -
Built-in Functions & ARGS
04:32 -
Write Your Own Functions And Arguments
05:39 -
Scripts
07:36 -
Attributes and Names
04:46 -
Characters
04:43 -
Doubles
03:31 -
Logicals
02:27 -
Factors
06:41 -
Atomic Vectors
02:43 -
Integers
03:23 -
Dim & Dimensions
05:46 -
Coercion
04:27 -
Lists
06:42 -
Matrix & Matrices
04:43 -
Arrays
03:42 -
Packages
04:00 -
Class
03:13 -
Getting Help with Help Packages
03:43 -
Install Bioinformatics Packages
05:25 -
Library & Initialization of Packages
02:28 -
Loading Biological Data
07:56 -
Zero Notation for Subsetting Biological Datasets
01:09 -
Saving Biological Data
05:27 -
R Notation & Selecting Values from Biological Dataset
04:09 -
Data Frames
06:30 -
Positive Integers for Subsetting Biological Dataset
05:26 -
Negative Integers for Subsetting Biological Dataset
05:28 -
Dollar Signs for Biological Dataset Subsetting
02:58 -
Blank Spaces For Biological Data Subsetting
03:21 -
Modifying Values in Existing Datasets
07:06 -
NA Values in Biological Dataset
05:25 -
Figuring out NA Values in Biological Dataset
02:06 -
Logical Subsetting in Biological Datasets
09:46 -
If Else Statement
04:15 -
For Loops & Biological Data Binding
16:30 -
While Loops & Reading Multiple Biological Datasets
16:16 -
ggplot2: Key components
08:26 -
ggplot2: Human Mitochondrial Proteome & Aesthetics (Size, Shape, Color)
26:06 -
ggplot2: Facetting of Human Genome
22:25 -
ggplot2: Smooth Out the Biological Data
08:43 -
ggplot2: Boxplots for Human Mitochondrial Proteome
07:56 -
ggplot2: Histograms for Human Mitochondrial Pattern Finding
06:02 -
ggplot2: Frequency Plots for Human Mitochondrial Information Frequency Mining
06:13 -
ggplot2: Bar Charts Human Mitochondrial Knowledge Mining
10:43 -
ggplot2 – Scaling and Limiting Data Visualization
03:53 -
ggplot2 – Changing Labels and Finalizing Visualization
08:42 -
ggtree – Phylogenetic Tree Visualization
05:41 -
ggsave – Saving the Visualizations in High Resolution
04:45
Evaluation
Earn a certificate
Add this certificate to your resume to demonstrate your skills & increase your chances of getting noticed.