Advanced ggplot2 Biological Data Visualization in R
About Course
Advanced ggplot2 Biological Data Visualization In R Allows You To Develop Your Data Visualization Skills In R Programming
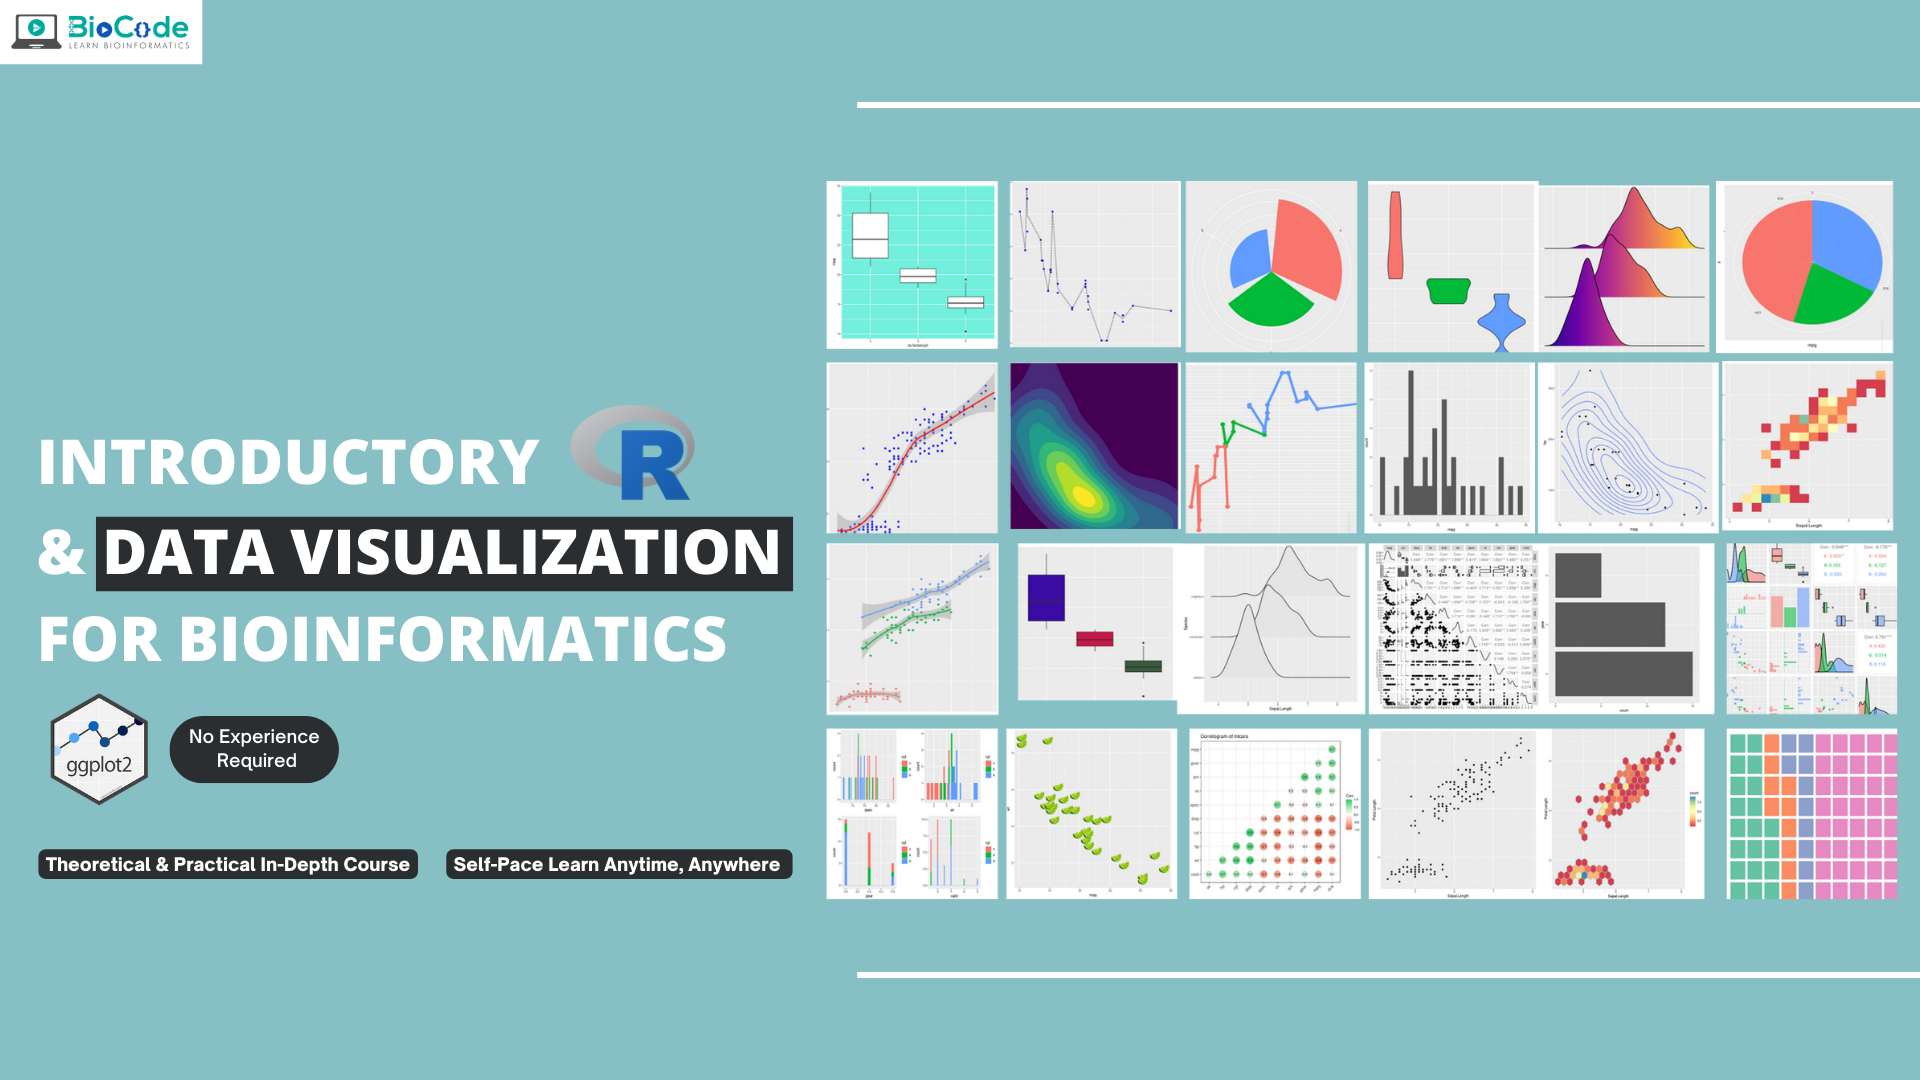
Data visualization is the process of graphical representation of unstructured or structured data to display information hidden in the plots/graphs. The approach not merely used the visualization tools to present data in the form of graphs but also looking at the world from a graphical point of view.
R provides various packages to analyze biological datasets. The ggplot2 package of R provides various functions to create different graphs, allows modification, annotation and much more.
In this course you’ll learn various concepts to write R scripts and programs to generate publication-ready and high quality graphical plots of biological datasets to visualize, analyze and compare the datasets in a more insightful way.
Joining and learning from the Advanced ggplot2 Biological Data Visualization in R can enhance your biological programming career by learning through various useful & informative pre-recorded lectures on various ggplot2 functions to create interactive plots on biological datasets.
Not ready to enrol?
Get the free syllabus & course updates
We'll email you the full outline for this course plus a starter guide — no spam, unsubscribe anytime.
Tools & technologies you'll use
- R
Course Content
Data Visualization: ggplot2
-
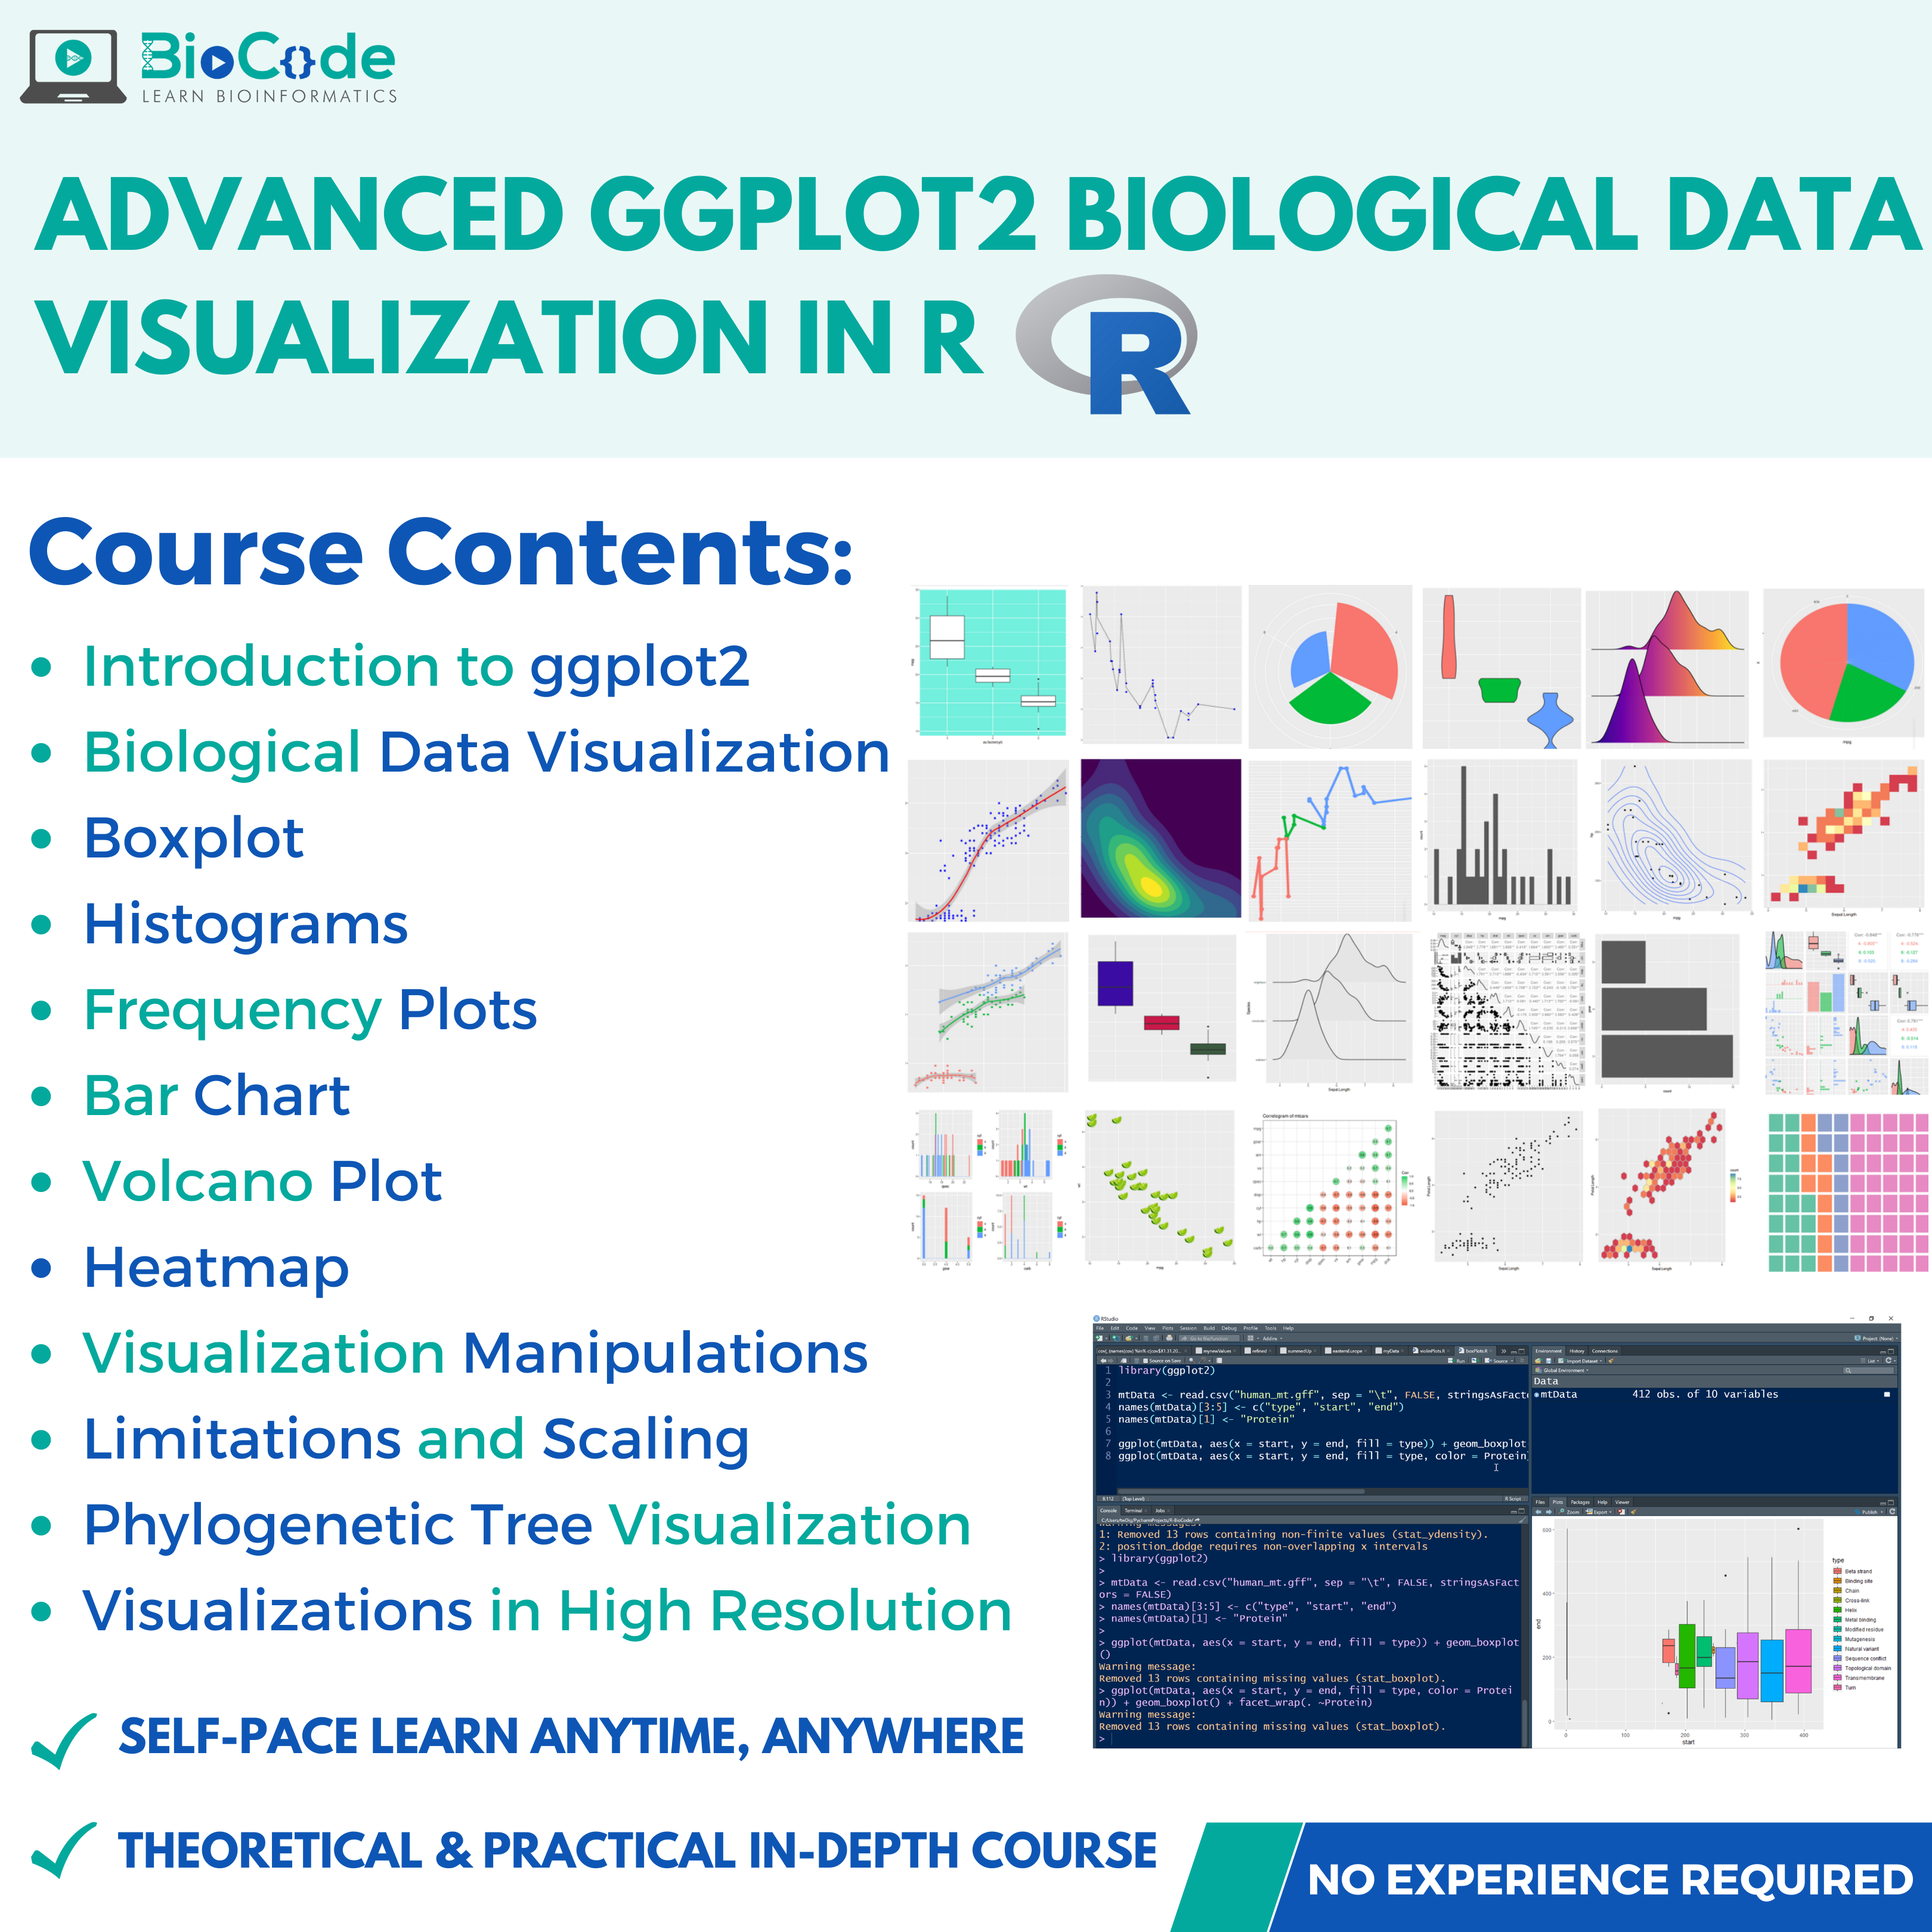
Introduction to ggplot2 for Biological Datasets
10:46 -
ggplot2: Key components
08:26 -
ggplot2: Human Mitochondrial Proteome & Aesthetics (Size, Shape, Color)
26:06 -
ggplot2: Facetting of Human Genome
22:25 -
ggplot2: Smooth Out the Biological Data
08:43 -
ggplot2: Boxplots for Human Mitochondrial Proteome
07:56 -
ggplot2 :Histograms for Human Mitochondrial Pattern Finding
06:02 -
ggplot2: Frequency Plots for Human Mitochondrial Information Frequency Mining
06:13 -
ggplot2: Bar Charts Human Mitochondrial Knowledge Mining
10:43 -
ggplot2 – Scaling and Limiting Data Visualization
03:53 -
ggplot2 – Changing Labels and Finalizing Visualization
08:42 -
ggtree – Phylogenetic Tree Visualization
05:41 -
ggsave – Saving the Visualizations in High Resolution
04:45 -
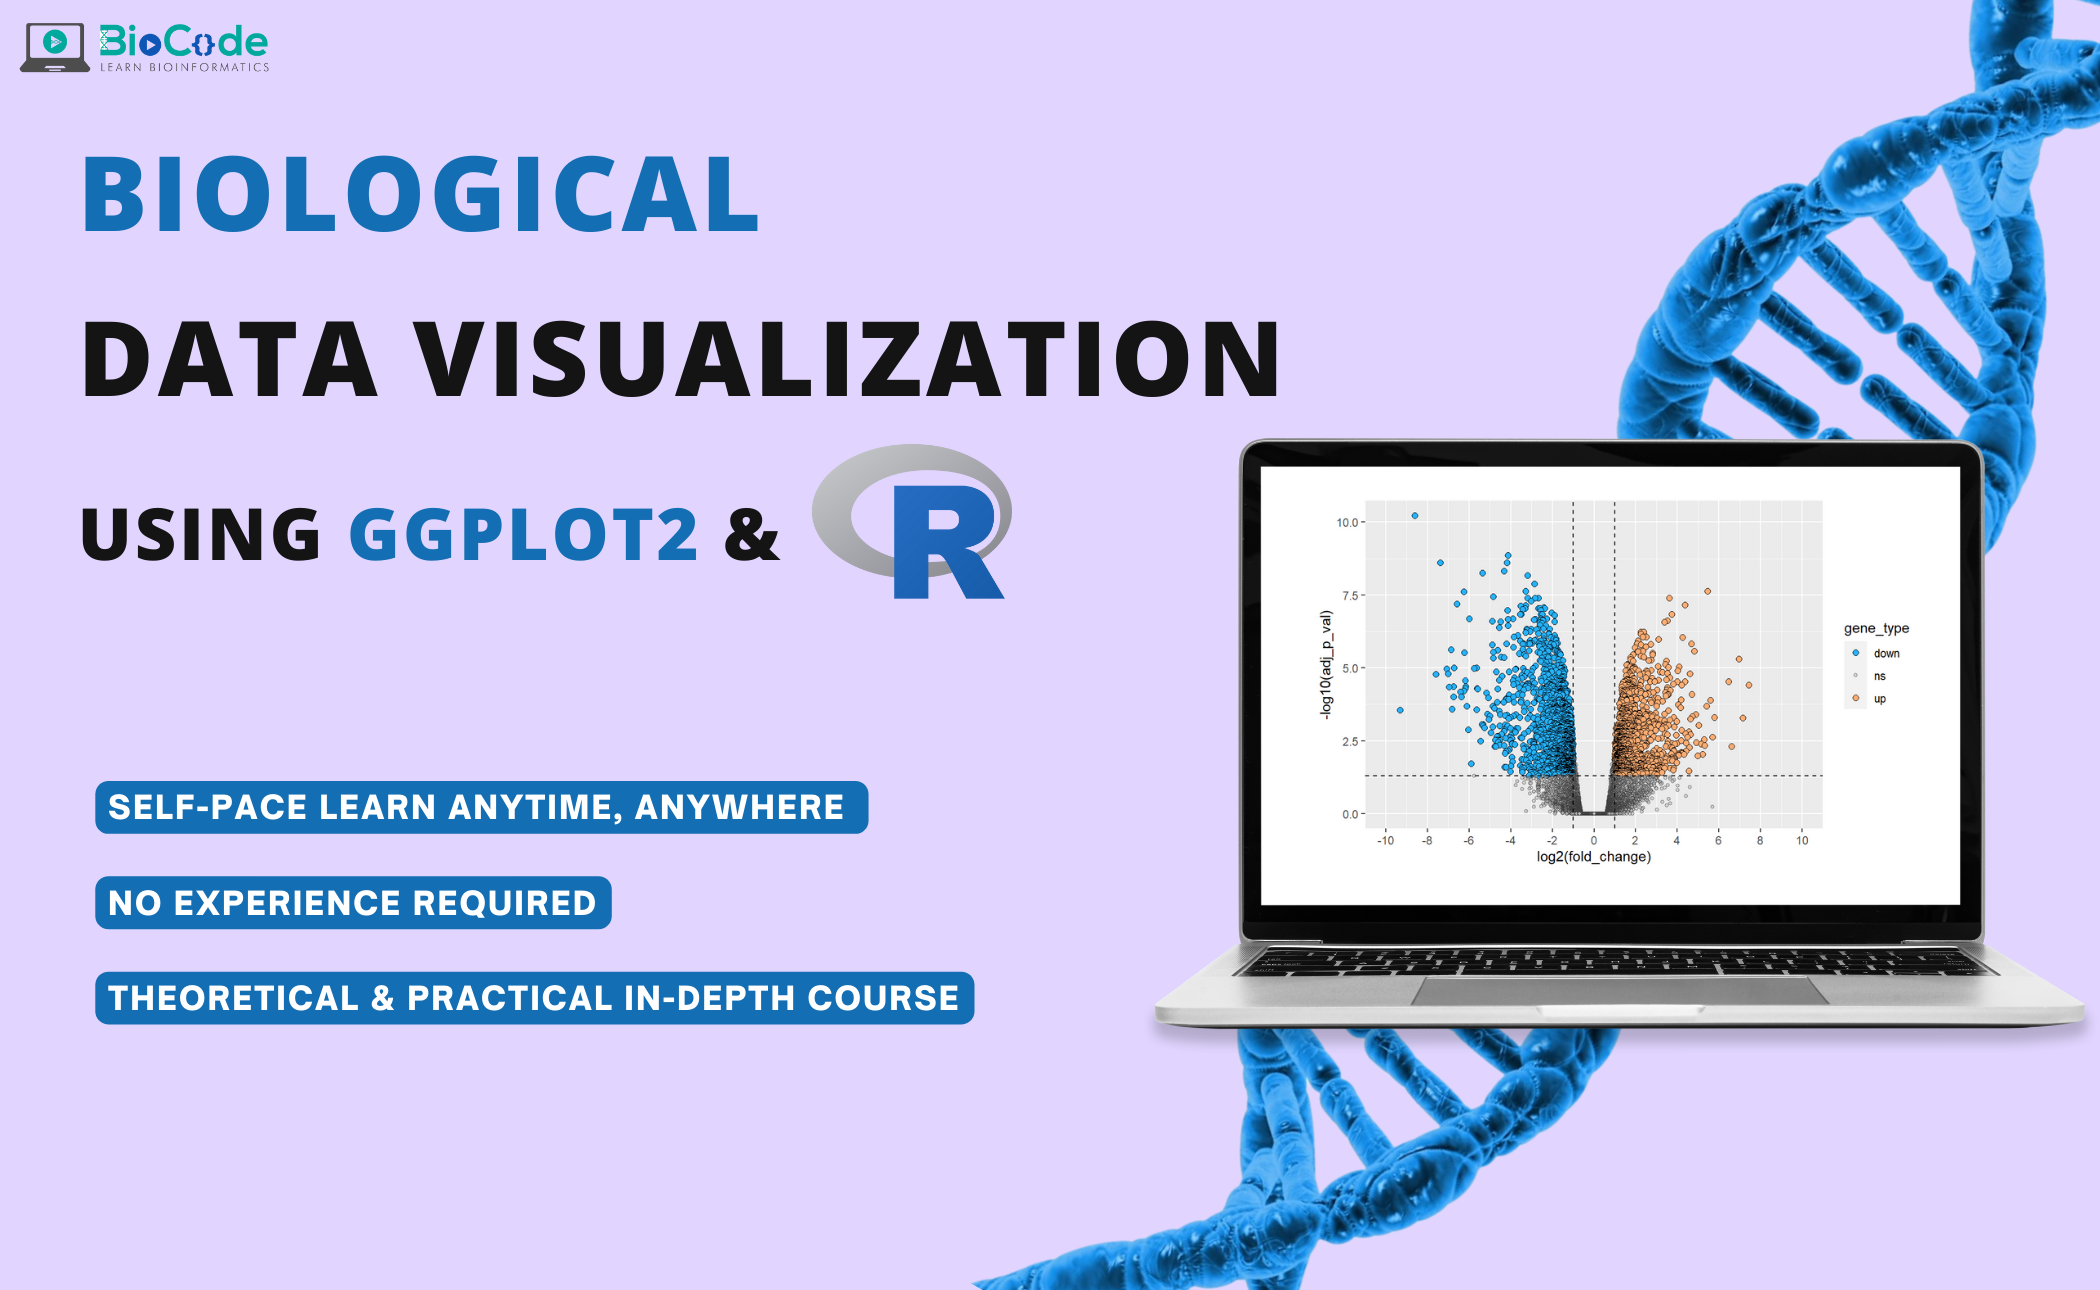
Volcano Plot Visualization – Finding Differentially Expressed Genes
08:36
Evaluation
Earn a certificate
Add this certificate to your resume to demonstrate your skills & increase your chances of getting noticed.