What are Transcription Factor Binding Sites?
Gene expression regulation is done by transcription factors (TFs). They control the transcription of genes and hence gene expression. They are involved in initiating transcription depending upon the type of cells, disease status, and stage of development. TFs work by binding to specific DNA sequences through their DNA-Binding domain (DBD). The sequence to which they bind is known as the transcription factor binding sites (TFBS) and usually, they have a length of 6-20 bp containing variable sequences.
The identification of TFB is very important to comprehend transcriptional regulation. Also, it is not possible to find all TFBS experimentally for all types of cell and cell conditions. Therefore, computational-based and high throughput approaches have been developed to identify TFBS.
What is ChIP-Seq?
Chromatin immunoprecipitation (ChIP) is an antibody-based technique that is used to enrich specific DNA-binding proteins in addition to their DNA targets. This is used to investigate a specific protein-DNA interaction or multiple protein-DNA interactions across a subset of genes or the whole genome. Chromatin immunoprecipitation (ChIP) assay when combined with sequencing resulted in a powerful high-throughput technique known as the ChIP-Seq. This technique identifies the TFBS of different TFs and proteins in the whole genome.
The use of next-generation sequencing (NGS) in ChIP has given information about multiple events of gene regulation allowing us to know about various disease and biological pathways including cancer progression and development stages. ChIP-Seq works by enabling interaction among nucleic acids and proteins at a genome-wide level.
A brief history of ChIP-Seq
The first time ChIP-Seq was developed by G Robertson and his coworkers in 2007 to identify mammalian DNA sequences that are bound by TFs in vivo. They utilized ChIP-seq to map activators and signal transducers of transcription 1 targets in human beings. They were able to identify 41,582 and putative 11,004 binding sites in human cells. This experiment showed a high coverage rate and high accuracy of this technique.
The next important experiment was conducted by Cheung’s group who were able to generate a large amount of global binding maps of androgen receptors and also of over-expressed histone deacetylases in prostate cancer. The outcome was a bit surprising; it reveals that histone deacetylases are directly taking part in androgen-regulated transcription and are present in the androgen receptors (AR) transcriptional networks. Also, they showed that they have a role in the repression of AR-mediated gene transcription which is important for epithelial differentiation and prevents metastasis. This ChIP-seq was able to give information that was critical in overcoming prostate cancer. This proves the critical role of ChIP-seq in identifying transcriptional networks
Besides mammalian cells, C. elegan’s regulation of gene expression by specific TFs is quite important for many developmental programs. It depends upon TFBSs in the genome. In the Model Organism Encyclopedia of DNA Elements (modENCODE) Consortium, Reinke and his coworkers have utilized ChIP-seq to identify TFBS in the whole genome. They were able to identify 22 TFBS at distinct development stages. They were also able to identify candidate gene targets in coding and non-coding regions. They found out that the binding site of many TFs lies in a few hundred nucleotides present at the transcription start site. Overall, Reinke’s group was able to give a comprehensive mapping of TFBS of C. Elegans that regulate different developmental stages. It also proved the importance, efficiency, and accuracy of ChIP-seq in determining TFBS.
Workflow of ChIP-seq analysis
ChIP-seq is a pivotal technology for epigenomic research and study. ChIP is the method of choice for studying epigenomic signatures. To carry out a ChIP assay, the histones proteins or the transcription factors of interest are cross-linked with their genomic DNA substrates in the living cell. This enables us to take a snapshot of the protein-DNA or histone-DNA interaction in the specific type of cell at different developmental stages or the cells that have been modified due to disease. Then, the chromatin is isolated and fragmented and for capturing protein-DNA complexes, specific types of antibodies are used that are specific for histones or transcription factors. After the crosslinks are reversed, the ChIP DNA is purified and analyzed either with the help of high-throughput sequencing.
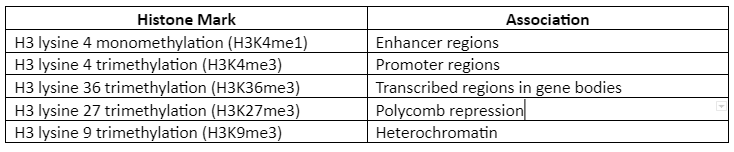
Roadmap Epigenomics Consortium has proposed five “core histone marks” which are given by following table 1:
Table 1: Five Histone Mark and their association
Generally, the following steps are involved in ChIP seq analysis:
Step One: Retrieving ChIP-seq data from the database:
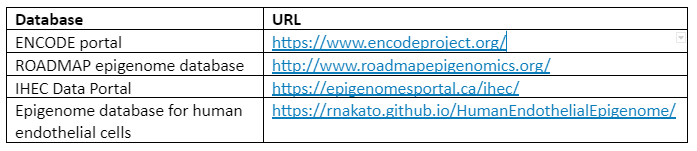
Many public databases are available for retrieving data on ChIP-seq histone modification. Many data types are available like reads, bigwig files, map files, and peak lists. Some of the public databases are given in table 2:
Table 2: Public database for ChIP-seq
Step Two: Technical Considerations
Many factors ensure the ChIP analysis’s reliability and accuracy. One of the factors is antibody quality which is quite crucial as the chances of false-positive results are higher due to the non-specific interaction of antibodies with DNA binding sites. This will affect the reproducibility and accuracy of ChIP-seq analysis, so multiple antibodies must be used to validate the results.
Besides antibodies, it must be taken into account that most of the ChIP-seq tools are intended for sharp peaks present in specific locations of genomes like Transcription start sites (TSS) but some of the histone modifications are linked with broader genomic domains and result in enrichment across extensive regions i.e., several hundred kilobases. So, the type of histone modification and its impact must be taken into account.
Step three: Map Reads
The sequence reads which are obtained are in FASTQ or CSFSATQ format, and are mapped with the help of tools like Bowtie, Bowtie2, or BWA. Among these, Bowtie 2 and BWA take into account insertions and deletions (indels) with the help of gapped alignment which is suitable for pair-end or/and long reads.
The map files have many output formats. These include BAM, CRAM, SAM and tagAlign. The BAM format is popular and more widely used while the more efficient CRAM format is still developing and is most likely to become the next standard format.
After the alignment is done, the mapped reads are aligned to the same positions on the genome which then filters out redundant and non-redundant reads. The non-redundant reads will be used for analysis.
Step Four: Peak calling
To identify significantly rich loci in the genome, we do the peak calling step. The output generated after peak calling is mostly in the BED format. One of the significances of ChIP-seq is the fact that it has no prior information about the strand but it can give estimation from gene information when analyzing histone marks that are enriched around TSS.
The most commonly used tool for peak calling is MACS2, but many other tools are also present. But it must be kept in mind that no tool can give 100% accuracy. To make results more authenticated, a strategy is adopted in which a large number of peaks are obtained with the help of a relaxed threshold that has noise and true positives. After that, the subgroups are extracted in another way like the selection of signals that are more consistent among biological replicated by using the Irreproducible Discovery Rate (IDR).
Step Five: Quality Assessment
It is a critical step because it is the checkpoint where it is assessed whether the ChIP-seq samples data is of high quality or not for analysis. Many QC measures have been established. The important features are:
Mapping ratio: it is the reflection of read quality and the amount of sequence reads obtained from genomic DNA. A good mapping ratio is 80%.
Read Depth: It is the number of non-redundant mapped reads. It depends upon the size of the genome.
Library Complexity: It is the proportion of non-redundant reads as compared to other mapped reads. It ranges from 0 to 1.0.
The normalized Strand Coefficient (NSC): It indicates both broad and sharp marks. The recommended threshold value of NSC > 5.0. The phantompeakqualtools is the only tool that can calculate NSC.
Background Uniformity (Bu): It is the reflection of read distribution bias present in background regions. Its range is 0 to 1.0. If the values are less than 0.8, then it represents more bias than expective which increases the number of false-positive results. But also, in the genome with high copy number variation like MCF-7 cells, a relaxed threshold value is given i.e., >0.6.
GC Summit Bias: It shows biases that are present during the immunoprecipitation and amplification using PCR. Generally, the GC summit of ChIP-seq data turns out to be similar to the reference genome (~50% for humans).
Step 5: Visualization
It is carried out to analyze ChIP-seq data intuitively. It can help to identify some suspicious peaks. The tools utilized for this purpose are Integrated Genome Viewer (IGV) or SeqMonk.
Step 6: Comparative Analysis Normalization:
This step is important as it diminishes the technical variance present in reads before a detailed comparative analysis. For this purpose, simple total read normalization is used, it keeps the sample read numbers the same. The primary assumption is that the differences in mapped reads present between samples is significantly smaller than the total number of reads. Now, this assumption is not always fulfilled and hence, many methods and tools are developed to recognize differentially enriched regions that are present among the two conditions, while some of the tools are specifically developed for histone modification data. The outcome will depend upon the choice of method as every method has its statistical hypothesis. So, choosing the right method is quite important.
A quantitative comparison is very complicated with more than two groups. When the signal to noise (S/N) value is the same between samples than the statistical tools which incorporate differential gene expression can be utilized. In cases where S/N is highly variable among samples then a spike in analysis can be used while quantile normalization is used when the most common peak is the same in samples.
Step 7: Analysis of ChIP-seq with DROMPAplus
It is the most popular ChIP-seq tool as it fulfills many needs like QC, normalization of reads, statistical analysis, and visualization. DROMPAplus is not a species-specific tool, it can be used for any species whose genomic sequence is available. Therefore, it has been used in ChIP-seq of mice, humans, yeast, and chicken. the advantages of DROMPAplus are:
The output is provided in a pdf file format which is easy to handle by users as they can share it easily with other collaborators.
Accept many input file formats (including CRAM).
Visualize two samples in a single line which defines co-occurrence and exclusivity of reading enrichment.
Automated estimation of fragment length from the single-end reads.
Highly customizable.
Motif Analysis
It is a very important and useful analysis. It not only identifies the DNA binding motif which is TFBS but also has many important roles. If the motif of a protein is already known, then this analysis provides validation and acts as proof of the success of the experiment. In the second scenario, when the motif is not known, then it can tell us about the success of the experiment through the identification of a centrally located motif that is present in a large number of peaks. It is also useful in the identification of DNA-binding motifs of those proteins which bind in conjunction or complexes with our ChIPed protein thus elucidating transcription regulation.
Motif analysis is useful in genomic regions that are identified with the help of peak calling tools or algorithms. The steps involved in motif analysis are:
Assemble genomic sequences in FASTA format as per the ChIP -seq peaks
Motif Discovery: In this step, it is better to input peak sequences of two or more than two of many algorithms. This will allow the discovery of motif sequences in unaligned DNA sequences.
Some of the motif discovery algorithms are a part of the pipeline that can do many motif analysis including motif enrichment algorithm and motif discovery algorithm that can recognize motifs present only in a small number of peaks.
Comparison of motif discovered with known DNA motifs by utilizing a motif comparison tool. It will tell us about the ChIPed TF motif if the binding site is known. This in turn will help us to recognize other TFBS.
Central motif enrichment analysis determines whether known DNA-motifs are submitted (enriched near the center) of ChIP-seq peaks. It allows doing local motif enrichment analysis on central regions where TSS are overlapped with ChIP-seq peaks.
Additional motif spacing analysis which can detect preferable distance and arrangement within the pair of motifs representing physical interaction present between different TFs.
Motif Prediction maps and visualization is the final step. It represents the genomic locations of motifs that are present in ChIP-seq regions. In this final step, enriched or discovered motifs are utilized to scan ChIP-seq regions, and then the coordinates of the matched motifs are uploaded for visualization on the genome browser.
The workflow of the ChIP analysis is given by following Figure 1:
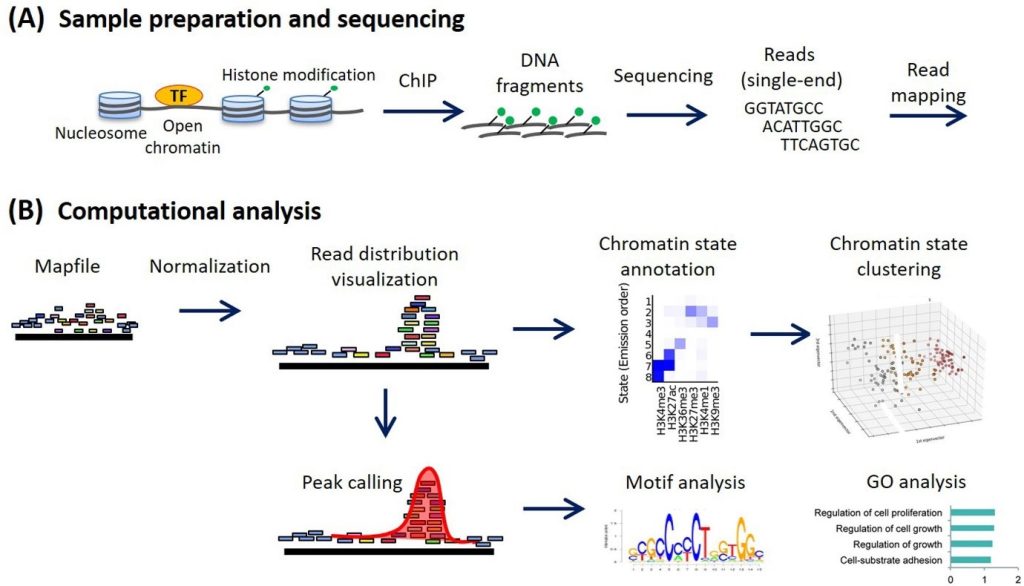
Figure 1: Steps involved in ChIP-Seq analysis
Advantages of ChIP-Seq
The ChIP-seq is different from all of the other approaches, which are used for epigenomic research, in the fact that it does not need any prior knowledge as it does not require probes from known sequences. It provides us with genome-wide profiling with the help of high throughput sequencing which generates millions of counts or reads per sample making it efficient, cost-effective, unbiased towards the experiment, and very useful to determine epigenetic patterns. Other advantages of ChIP-seq includes:
Ability to identify TFBS across the entire genome and of any species. It can capture any type of DNA target for histone modification.
Identification of already present and discovery of new TFBS, thus elucidation gene regulation at the transcription level.
Compatibility with multiple types of DNA samples.
Ability to reveal gene regulation networks.
Limitations
The limitations of ChIP-seq is given by:
Access and cost which is quite high as compared to other comparable techniques. For instance, the cost of the ChIP-chip technique is around 400-800 USD per array but that of the ChIP-seq is 1000-2000 USD per lane.
As the antibodies are used in immunoprecipitation, the data quality relies highly on the quality of the antibody used. As there is a high variation of quality for antibodies presents commercially. So, it is quite laborious and time-consuming to validate the quality of antibodies.
Multiple computational tools are used. Their algorithm varies which can change the output sometimes.
There is no consensus among scientists about the appropriate control which is required as the peak generated by ChIP-seq is compared to the same locus in control samples to comprehend the peaks.