Hands-on Biological Data Visualization with ggplot2 & R
About Course

Biological data visualization is an important aspect of bioinformatics which involves the graphical representation of unstructured or structured data to display information hidden in the plots/graphs. The ggplot2 package of R provides various functions to create different graphs and allows modification, annotation, and much more. Learning biological data visualization can not only help you in creating beautiful data visualization but also in making impactful decisions during your research based on data visualizations along with publishable figures for your research papers.
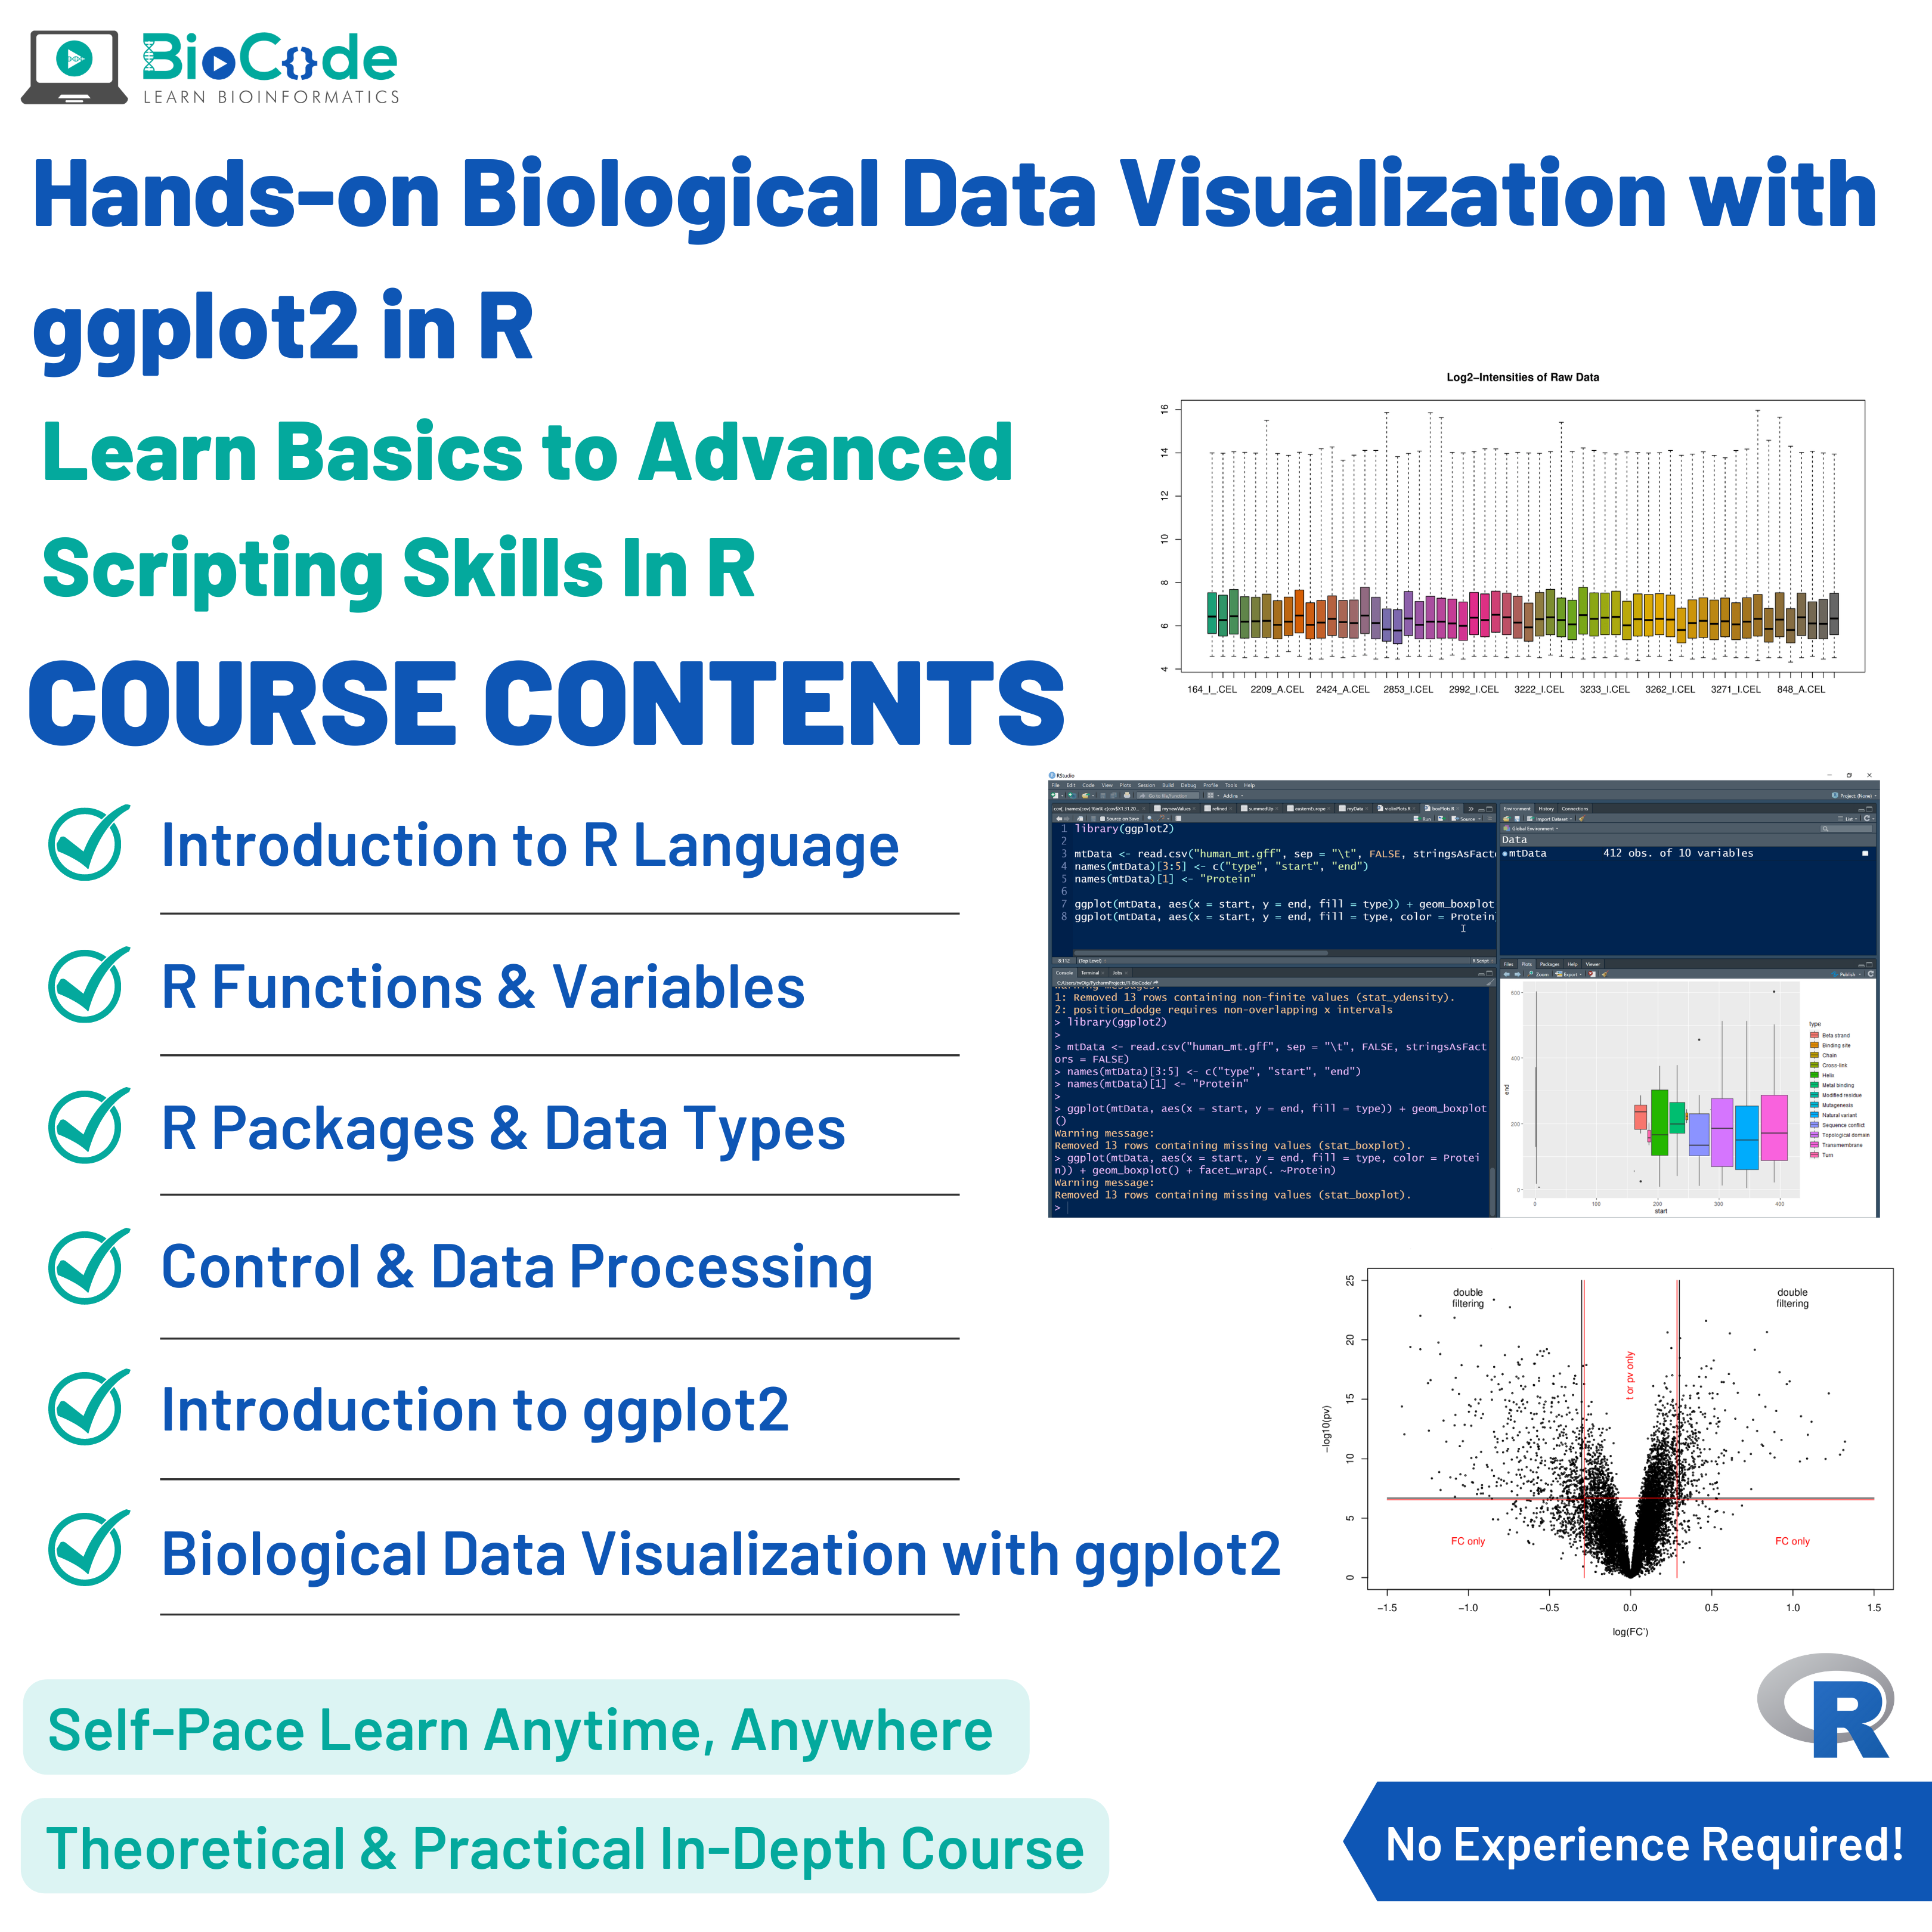
BioCode is offering an advanced biological data visualization with ggplot2 & R course in which you’ll learn how to write customized scripts to generate publication-ready and high-quality graphical plots of biological datasets to visualize, analyze and compare the datasets in a more insightful way, such as volcano plots, heatmap, dot plots, frequency plots, scatter plots, histograms, and bar charts with customized labeling. Even if you don’t know programming or R language at all, in this workshop you’ll learn R language from the basics to the advanced level and then apply your script-writing skills to data visualizations.
Whether you’re a beginner in bioinformatics, an experimental biologist, or a bioinformatics researcher, our course will help you greatly. You’ll be practicing on a case study of human mitochondrial proteome and genome along with a real-world gene expression dataset. Therefore, you’ll not only learn data visualization with ggplot2 in R, but you’ll also do real-world biological data visualization in this biological data visualization with ggplot2 in R workshop.
This course will include the following section:
Section 1: Data Visualization Using ggplot2
Description: This section will focus on making sure that the students learn how biological data is visualized using the ggplot2 package in R language.
Learning Outcomes: Upon completion of this section, students will be able to:
- Explain ggplot2 and its Use in Biological Data Representation.
- Describe Key Components in ggplot2.
- Visualize Human Mitochondrial Proteome.
- Facet the Human Chromosome Dataset.
- Smooth Out the Biological Data.
- Create Box Plot for Human Mitochondrial Proteome.
- Create Histograms for Human Mitochondrial Pattern Finding.
- Create Frequency Plots for Human Mitochondrial Information Frequency Mining.
- Create Bar Charts for Human Mitochondrial Knowledge Mining.
- Scale and Limit Data Visualization.
- Change Labels and Finalize Visualization.
- Visualize a Phylogenetic Tree.
- Save Visualizations in High Resolution.
- Find Differentially Expressed Genes With Volcano Plot Visualization.

Course Content
Segment 1: Introduction to R Language & Installation
-
Introduction to R in Bioinformatics & R Installation
09:48 -
The R Studio Interface
06:23 -
Comments
04:17
Segment 2: Introduction to Functions & Variables in R
Segment 3: Introduction to Packages & Data Types in R
Segment 4: Control Flow & Biological Data Pre-processing in R
Segment 5: Biological Data Visualization via ggplot2 in R
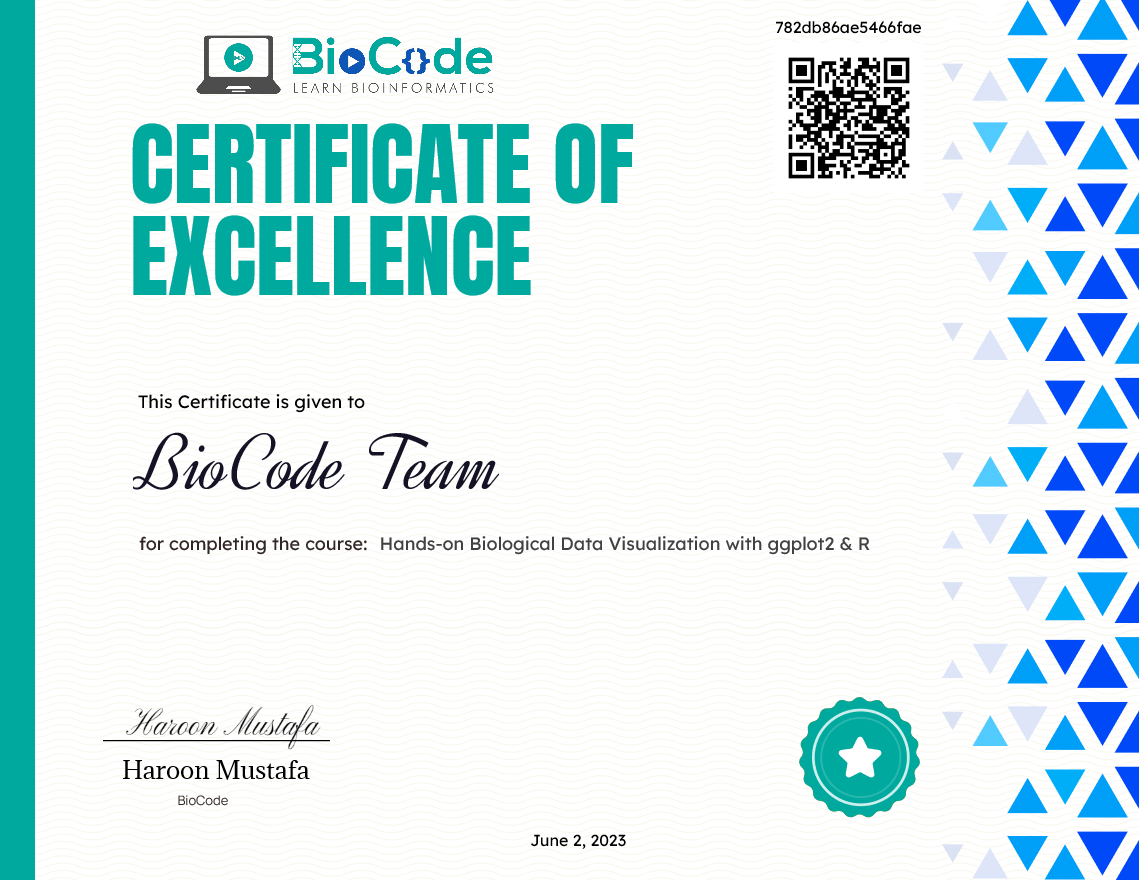
Earn a certificate
Add this certificate to your resume to demonstrate your skills & increase your chances of getting noticed.

Student Ratings & Reviews

